

What Are the Best-Performing U.S. Leveraged ETFs Year-to-Date? Memory Chip Products Lead the Gains, Are They Worth Investing In?


AI Podcast
U.S. leveraged ETFs have led performance rankings since 2026, with triple-digit gains in semiconductor and South Korean market products driven by AI hardware and memory chip demand. Products like MUU, SOXL, and KORU amplify returns from Micron, Nvidia, and South Korean chip giants. Broader tech ETFs such as TECL and TQQQ, while gaining, faced headwinds from mega-cap valuations and interest rate concerns. Investors should note the significant volatility decay risk inherent in leveraged products, particularly for longer-term holding.
TradingKey - Since 2026, U.S. leveraged exchange-traded funds (ETFs) have dominated the top of the performance rankings, with several 3x long products tracking the semiconductor and South Korean markets achieving triple-digit gains, reflecting strong investor bullishness toward tech stocks and the memory chip cycle.
A leveraged ETF is an exchange-traded fund that utilizes financial derivatives and debt instruments to amplify the daily returns of an underlying index (e.g., 2x or 3x).
Top 10 Best-Performing Leveraged ETFs Year-to-Date (AUM > $1 Billion)
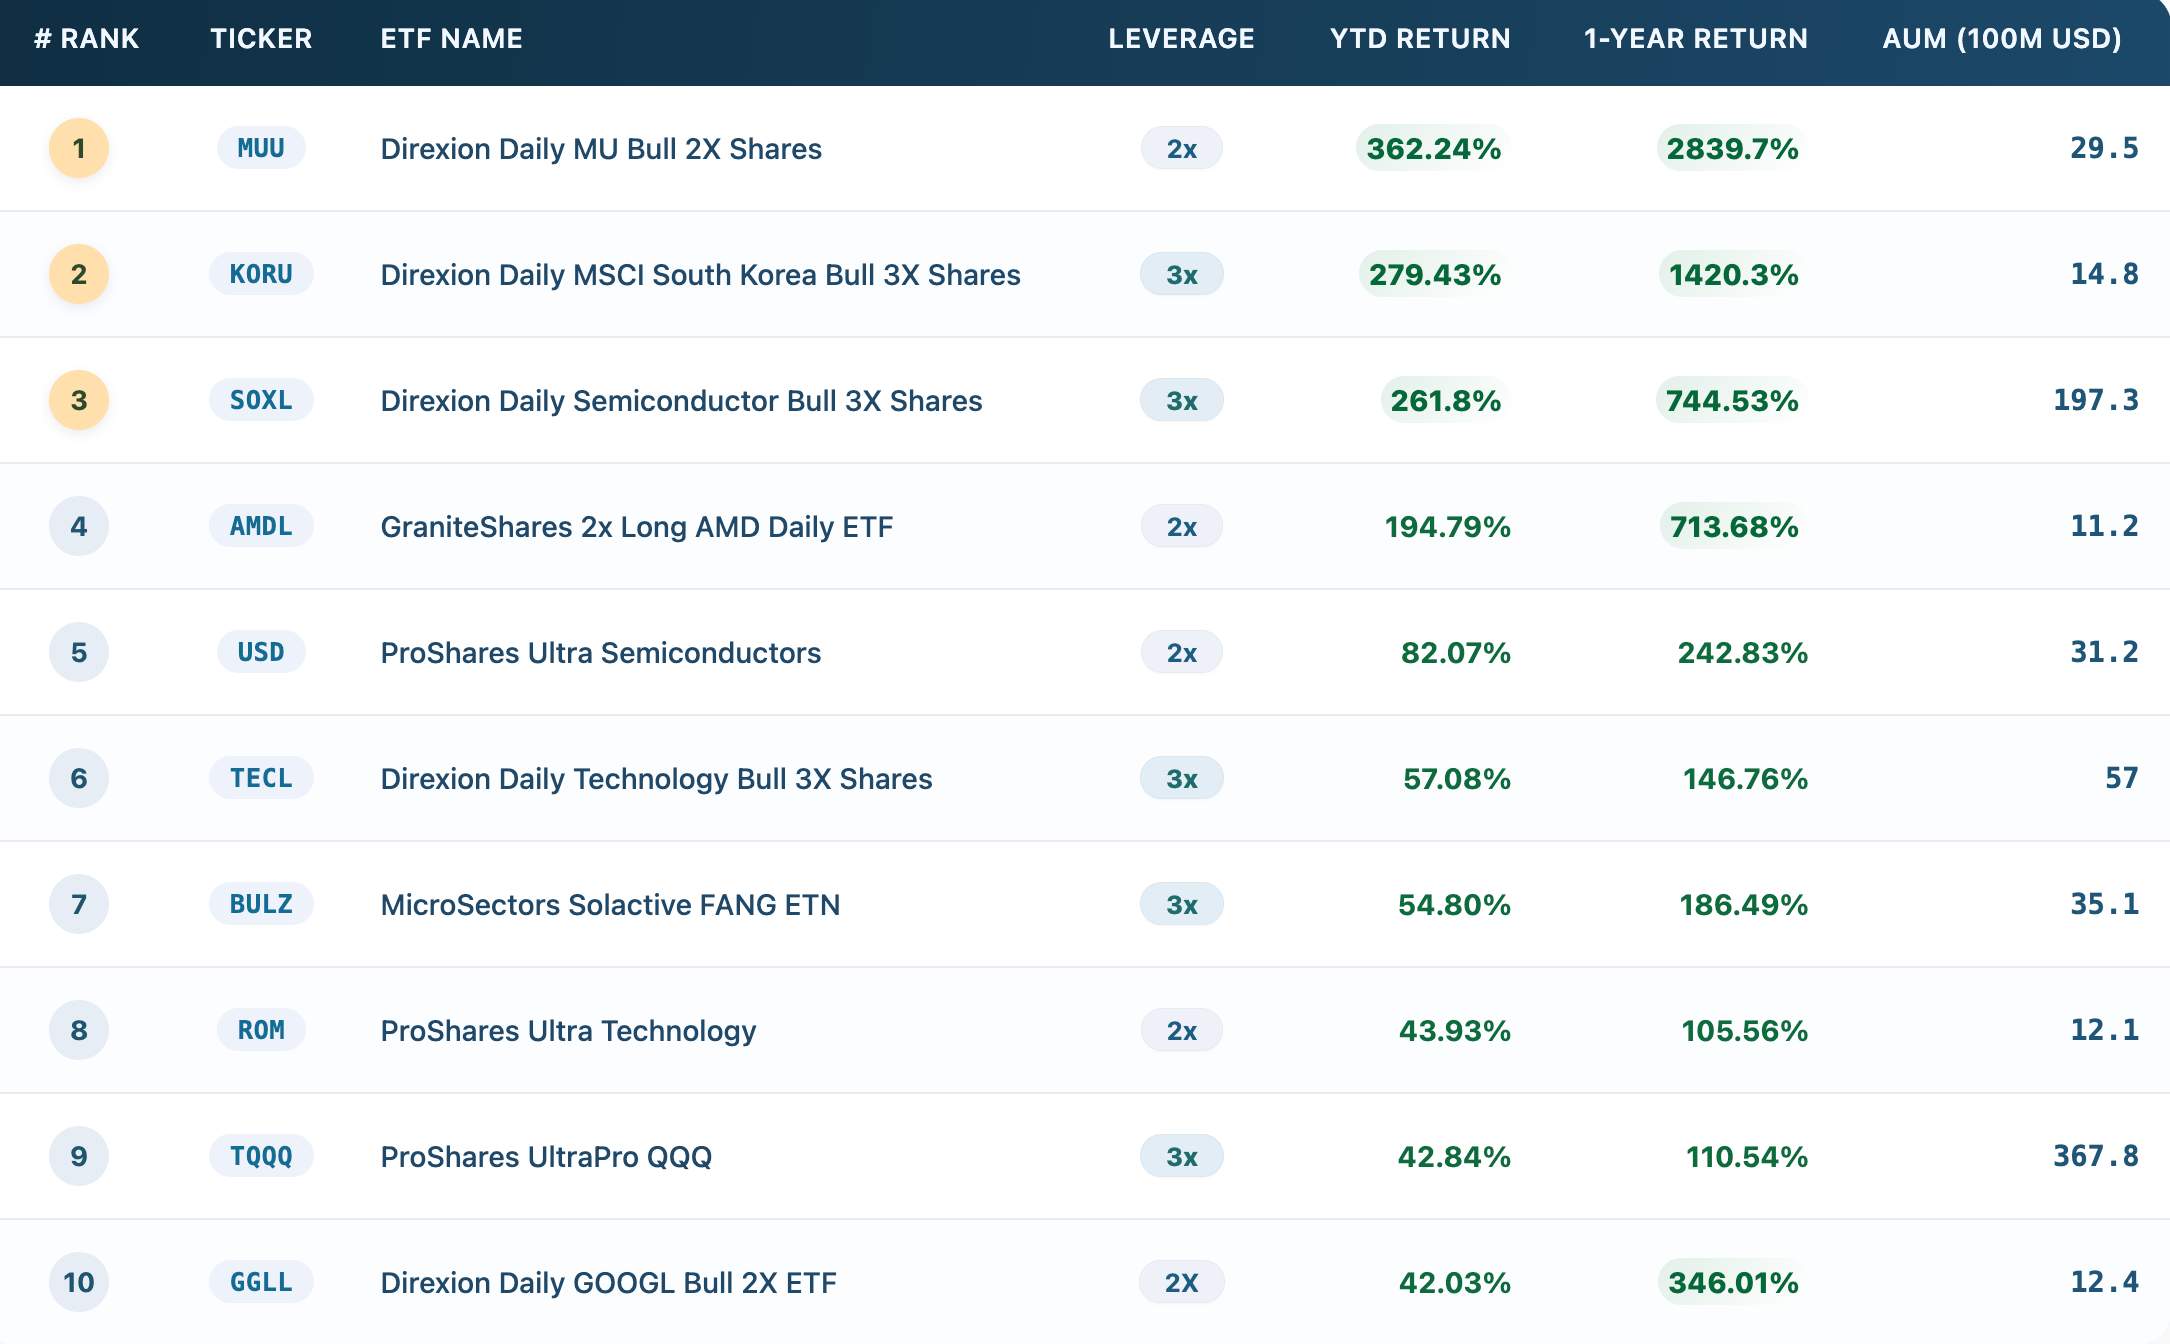
[Source: TradingView, data as of May 19]
Semiconductors and Memory
MUU, SOXL, KORU, AMDL, and USD are driven by AI hardware, including memory chips, GPUs, and semiconductor equipment. The memory supercycle and the expansion of AI capital expenditures directly push up these underlying assets, while the leverage effect amplifies returns.
Direxion Daily MU Bull 2X Shares ( MUU ) seeks to provide twice the single-day performance of Micron Technology ( MU) daily returns; the core logic driving the surge in MUU is the memory chip supercycle. As the world's third-largest DRAM supplier and a major player in NAND flash memory, Micron deeply benefits from the explosive demand for HBM and high-bandwidth memory in AI servers. Micron's production capacity has been fully booked by customers, and earnings expectations have been revised upward significantly.
However, once the memory supply-demand relationship reverses and leads to a pullback in memory prices, MUU may experience a drawdown far exceeding that of Micron's common stock.
Direxion Daily MSCI South Korea Bull 3X Shares ( KORU ) : A triple-leveraged ETF tracking the MSCI Korea Index, with an asset size (AUM) of approximately $1.48 billion and a year-to-date return of 279%. KORU's holdings are highly concentrated; in the MSCI Korea Index, Samsung Electronics and SK Hynix have a combined weight of over 45%. Therefore, this ETF is effectively a leveraged bet on the South Korean semiconductor giants.
Direxion Daily Semiconductor Bull 3X Shares( SOXL ): A triple-leveraged long semiconductor ETF with approximately $19.73 billion in assets under management and a year-to-date return of about 262%. Its underlying holdings cover 30 chip stocks, including NVIDIA ( NVDA) and Micron, offering excellent liquidity.
However, triple leverage carries significant volatility decay risk; long-term investors may consider the 1x leveraged SOXX or SMH as alternatives.
GraniteShares 2x Long AMD Daily ETF( AMDL ) : A double-leveraged ETF tracking AMD ( AMD )'s share price, with an asset size of $1.12 billion and a year-to-date return of approximately 195%. AMD benefits from the cost-performance advantage of the MI300 series in the AI inference market and an increase in server CPU market share, but faces competition from NVIDIA's Blackwell mass production and ASIC startups. This ETF has extremely high volatility and is suitable for short-term speculators.
ProShares Ultra Semiconductors( USD ) : A double-leveraged ETF tracking the Dow Jones U.S. Semiconductors Index, with an asset size of approximately $3.12 billion and a year-to-date return of about 82%. USD's holdings are relatively diversified, showing steady performance during broad sector rallies, but its elasticity is lower than that of SOXL when leading stocks surge.
Broad-based Tech Indices and Individual Stocks
TECL, ROM, TQQQ, GGLL, and BULZ are based on underlying broad-based tech indices or individual stocks, weighed down by valuation pullbacks in mega-cap tech, antitrust concerns, and fluctuating interest rate expectations. Even as the AI narrative persists, market concerns over return on capital expenditure and valuation digestion pressure have resulted in relatively lower gains for these products.
Direxion Daily Technology Bull 3X Shares ( TECL ) : 3x leveraged tracking of the Technology Select Sector Index, with an asset size of approximately $5.7 billion and a year-to-date return of about 57%. Holdings include sub-sector leaders such as Microsoft ( MSFT ), Apple ( AAP L), Nvidia, and other leaders in various sub-sectors; it is negatively correlated with the 10-year U.S. Treasury yield. Suitable for investors who believe the AI rally will spread from semiconductors to software and internet services.
ProShares Ultra Technology ( ROM ): 2x leveraged tracking of the Dow Jones U.S. Technology Index, with assets of approximately $1.21 billion and a year-to-date return of about 44%. The leverage is lower than TECL, resulting in less volatility decay, but liquidity is poorer and the bid-ask spread is wider. Suitable for traders who want to allocate to the tech sector with 2x leverage but cannot withstand 3x volatility.
ProShares UltraPro QQQ ( TQQQ ) : 3x leveraged tracking of the Nasdaq-100 Index, with assets of approximately $36.78 billion and a year-to-date return of about 42.84%.
Direxion Daily GOOGL Bull 2X ETF ( GGLL ) : 2x leveraged tracking of Google ( GOOGL ), with assets of approximately $1.24 billion and a year-to-date return of about 42.03%. Leverage is reset daily, making it suitable for short-term trading, as long-term holding may result in unexpected losses from volatility decay.
MicroSectors Solactive FANG ETN ( BULZ ) : 3x leveraged ETN tracking the Solactive FANG Innovation Index, with assets of approximately $3.51 billion and a year-to-date return of about 54.8%. The top ten holdings account for over 72% of the portfolio, concentrated in 15 mega-cap tech stocks such as Meta ( META ), NVDA, and others. The ETN structure carries issuer credit risk, which, combined with high concentration and 3x leverage, can result in single-day fluctuations exceeding 20%. Suitable for investors who are extremely bullish on tech stock performance in the short term.
This content was translated using AI and reviewed for clarity. It is for informational purposes only.
Recommended Articles


Comments (0)
Click the $ button, enter the symbol, and select to link a stock, ETF, or other ticker.