


Japan and South Korean Stocks Rise; Nikkei 225 Gains Over 2%, KOSPI Rises 0.65%,; SK Hynix, Samsung Slip



On August 10, Japanese and South Korean markets closed higher, supported by US market momentum following weaker-than-expected non-farm payrolls data. The Nikkei 225 rose 2.08%, while the KOSPI gained 0.65% despite intraday volatility that triggered a KOSDAQ "Sidecar" mechanism. Notable individual performances included declines in SK Hynix and Samsung Electronics, contrasting with Kioxia’s modest gain. Sentiment for SK Hynix remains supported by a potential 100 trillion won shareholder return plan, which would significantly exceed prior capital distribution levels. This shift underscores a broader regional trend focusing on enhanced shareholder value amidst shifting Federal Reserve rate expectations.

TradingKey - On August 10, Japanese and South Korean stock markets closed higher. SK Hynix and Samsung Electronics edged lower, Kioxia rose 0.59%, and SoftBank fell over 1%.
The Nikkei 225 Index closed up 2.08% at 66,970.22 points; the Korea Composite Stock Price Index (KOSPI) rose 0.65% to close at 6,299.66 points.
South Korea's KOSPI index rose more than 2% during morning trading, and the tech-heavy KOSDAQ index even triggered the sidecar mechanism, leading the Korea Exchange to suspend program buy orders. KOSPI subsequently pared its gains, temporarily turning down by 0.42% in the afternoon to hit a low of 6,232 points, before recovering its losses to finish higher.
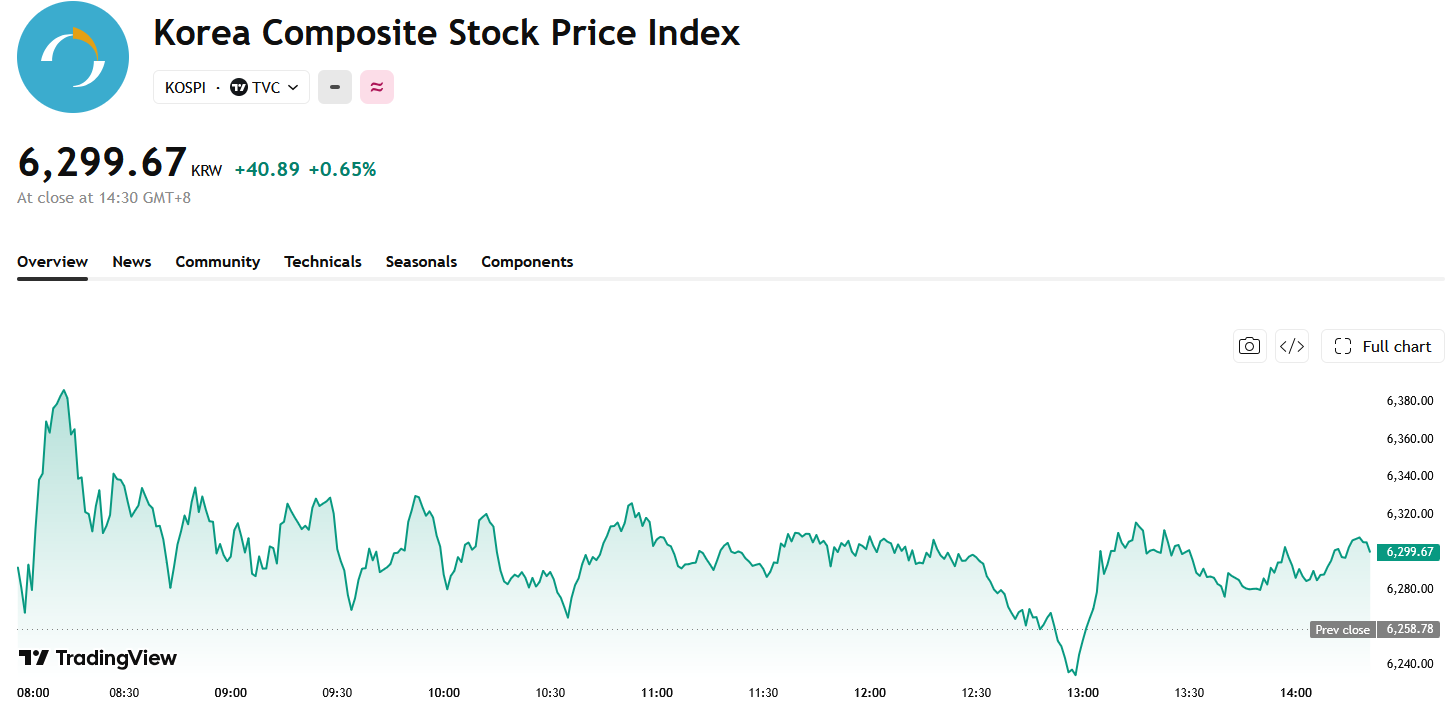
Source: TradingView
Among individual stocks, SK Hynix closed down 0.14% at 1,420,000 won (approximately $1,001); Samsung Electronics fell 0.43% to close at 230,000 won.
Kioxia rose 0.59% to 48,010 yen (approximately $303), while SoftBank Group fell 1.22% to 5,484 yen.
According to South Korean media reports, SK Hynix is considering launching a shareholder return program worth about 100 trillion won, with share buybacks potentially reaching approximately 40 trillion won, representing over 2% of the company's total outstanding shares. If implemented, the scale of this plan would be significantly higher than the company's previous shareholder return levels.
By comparison, SK Hynix's cash dividends and share cancellations totaled about 14.3 trillion won last year. The significant expansion of this potential buyback scale suggests that the company may further boost its capital returns, and is also expected to improve investor expectations regarding the company's valuation and long-term investment value.
Meanwhile, the overall rebound in Japanese and South Korean stock markets was also driven by last week's strength in US equities. The latest US non-farm payrolls data fell short of market expectations, reinforcing investor bets on further interest rate cuts by the Federal Reserve, with all three major US stock indexes recording solid gains last week.
This content was translated using AI and reviewed for clarity. It is for informational purposes only.
Recommended Articles











Comments (0)
Click the $ button, enter the symbol, and select to link a stock, ETF, or other ticker.