

Bitcoin Drops for 4 Straight Weeks, Falling Nearly $20,000. Amid Capital Outflow Wave, 60,000 Level Becomes Life-and-Death Line for Bulls


AI Podcast
Bitcoin prices have declined for four consecutive weeks, driven by sustained capital outflows from spot Bitcoin ETFs, totaling approximately $3.45 billion over 11 days. Global digital asset products also saw $1.67 billion in outflows last week. This indicates cooling institutional demand and a shift from inflows to existing capital retreat. Capital rotation into the AI sector and geopolitical risks further pressure Bitcoin. The $65,000 support level is being tested, with a break potentially leading to a decline towards $60,000, a critical monthly support. A failure at $60,000 could target $49,000.

TradingKey - Recently, weighed down by persistent capital outflows, Bitcoin ( BTCUSD) prices have dropped for a fourth straight week, with a cumulative loss of nearly $20,000, as the price approaches the $65,000 psychological level.
On June 3, Eastern Time, Bitcoin briefly broke below $66,000, hitting an intraday low of $65,426.34, and is currently trading in a volatile range near $67,150. Bitcoin has retreated nearly 9% so far this week, including a plunge of more than 6% on Tuesday, as overall market sentiment skews decidedly bearish.
Persistent capital outflows continue to weigh on Bitcoin prices, driving a downward trend.
From a fundamental perspective, the primary pressure remains the sustained capital outflows from spot Bitcoin ETFs.
CoinGlass data shows that U.S. spot Bitcoin ETFs have recorded a record 11 consecutive trading days of net outflows, with a cumulative outflow of approximately $3.45 billion; CoinShares' latest weekly report also indicates that global digital asset investment products saw a net outflow of $1.67 billion last week, of which Bitcoin products saw an outflow of $1.438 billion, the largest single-week Bitcoin outflow since 2026.
Analysts believe that spot Bitcoin ETFs were once the core capital channel for Bitcoin's rally, and the current streak of redemptions signifies a significant cooling in institutional allocation demand, as the market shifts from a foundation supported by incremental inflows to a retreat of existing capital.
Meanwhile, the strong performance of the AI sector in U.S. stocks and the record highs hit by the three major indices have caused capital to rotate from crypto assets into stronger AI and semiconductor trades. For institutions, the opportunity cost of holding highly volatile Bitcoin increases when AI stocks offer stronger trends and better liquidity. Coupled with geopolitical risks, oil price volatility, and uncertain expectations for Federal Reserve rate cuts, downward pressure on Bitcoin has intensified significantly.
Furthermore, according to disclosures by Strategy, the company sold 32 Bitcoins between May 26 and 31, with the proceeds used for preferred stock distributions. While this scale is almost negligible relative to its massive holdings, the selling action by a representative institution known for its long-term "buy-only" approach has weakened market confidence in the long-term absorption of Bitcoin by corporate treasuries.
Notably, the transfer of approximately 10,422 Bitcoins by Mt. Gox-related wallets has also reignited market concerns regarding potential supply pressure. Even if these transfers do not necessarily lead to an immediate sell-off, they are sufficient to amplify bearish interpretations during a period of fragile sentiment.
Bitcoin Price Technical Analysis: The $60,000 Level Becomes a Make-or-Break Line for Bulls
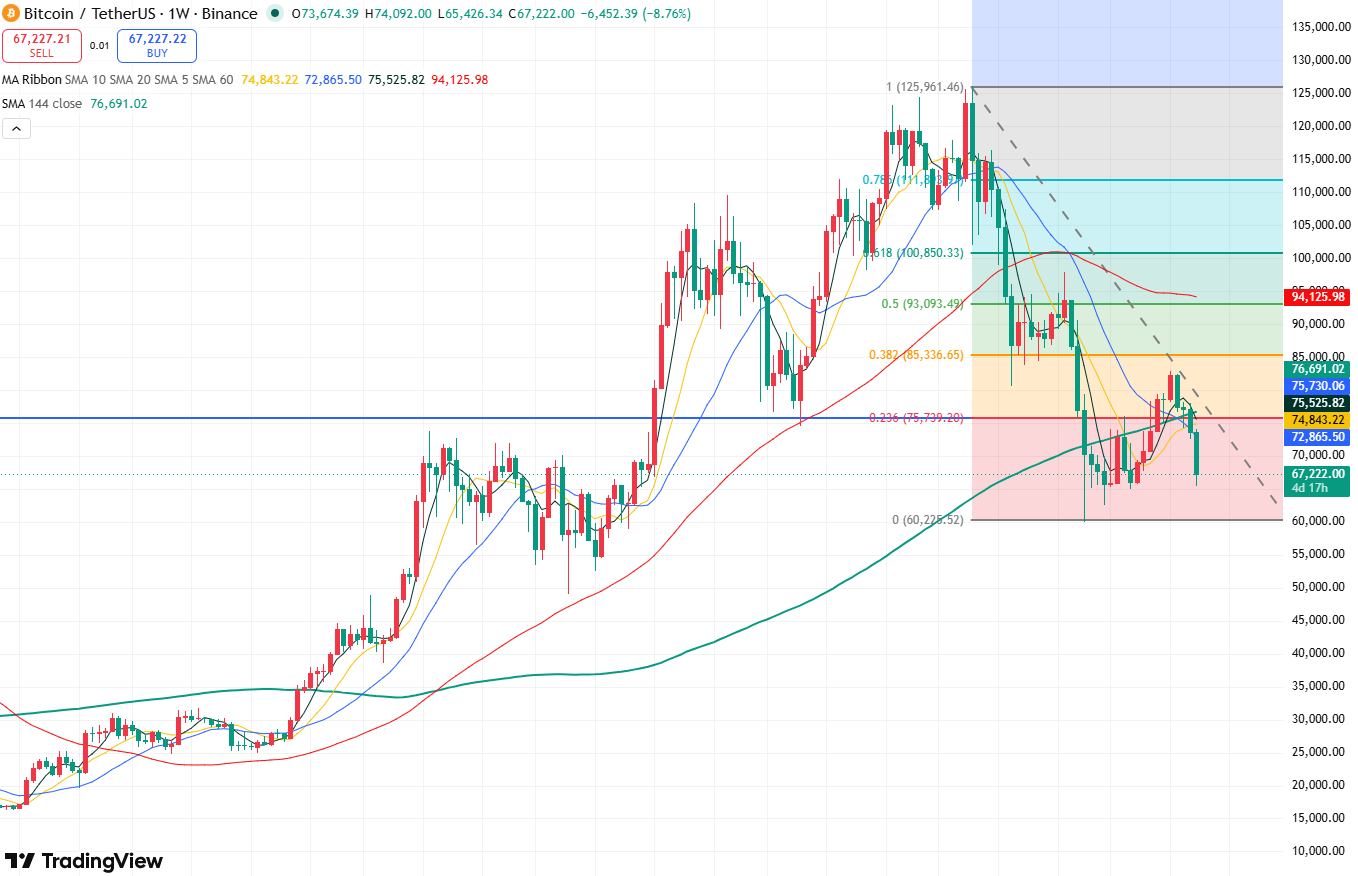
Bitcoin price weekly chart, Source: TradingView
Based on the Bitcoin weekly chart, the price has fallen for four consecutive weeks. Following the breach of the $70,000 support level, Bitcoin is currently testing the $65,000 support level; if this level fails, the price will further retreat toward the key $60,000 support level.
It should be noted that the $60,000 mark serves as critical monthly support for Bitcoin. Should this level be lost, it will open up downside potential toward the August 2024 low of $49,000. Conversely, if Bitcoin stabilizes above $60,000, a short-term technical rebound could begin, with the first objective being a test of the $75,000 resistance level.
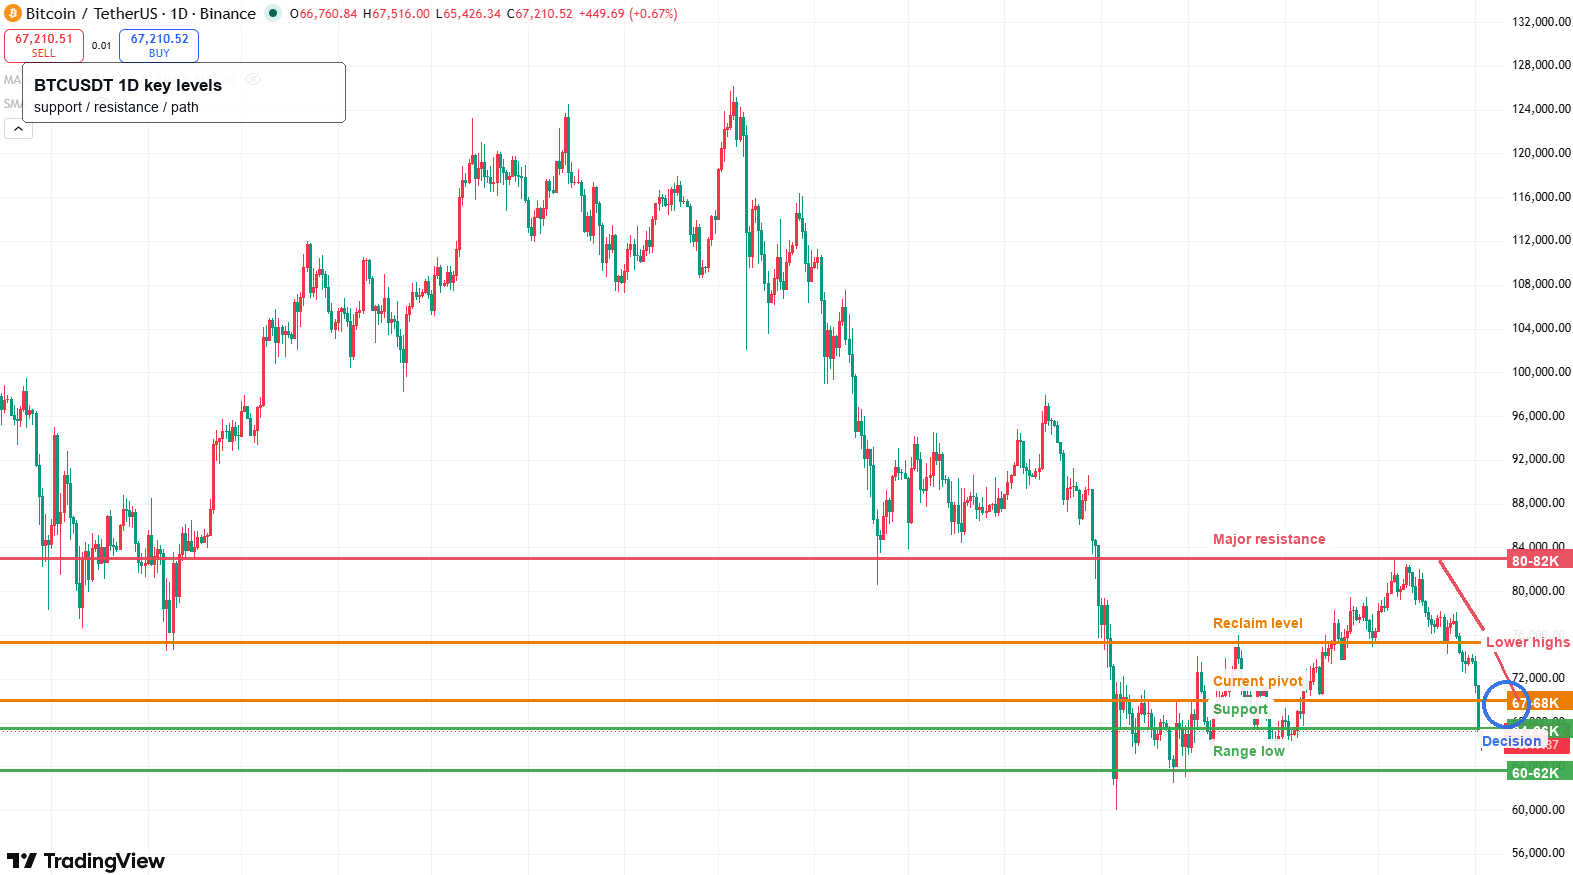
Bitcoin price daily chart, Source: TradingView
After retreating from its highs, Bitcoin's daily structure continues to show a pattern of lower highs. The current short-term key support is $64,000-$66,000; if breached, the next support levels to watch are $60,000-$62,000. On the upside, the price needs to reclaim the $72,000-$74,000 range to alleviate downward pressure and rally toward $80,000-$82,000.
This content was translated using AI and reviewed for clarity. It is for informational purposes only.
Recommended Articles


Comments (0)
Click the $ button, enter the symbol, and select to link a stock, ETF, or other ticker.