


Gold Price Forecast: US Treasury Expands Long-Bond Buybacks, Gold Benefits via Dual-Path Logic, May Test Interim High of $4,891



AI Podcast


On August 21 Eastern Time, spot gold (XAUUSD) broke $4,600, driven by the US Treasury’s expansion of long-term bond buybacks. This policy creates a dual-pathway boost: falling yields reduce gold's holding costs and weaken the dollar, while rising yields driven by fiscal deficits heighten sovereign credit and safe-haven demand. Technically, gold has surpassed key moving averages and the 0.618 Fibonacci level at $4,528.85, targeting $4,700. However, potential energy-driven inflation and rate-hike expectations pose periodic constraints. Sustaining support above the 5-day moving average is critical to maintaining the bullish structure toward $4,891.54.

TradingKey - Spot gold (XAUUSD) broke through the $4,600 mark on August 21 Eastern Time and is heading toward $4,700. This is also the first time gold has returned to this level since May 15.
Looking at the immediate factor driving the rise in gold prices, it was the US Department of the Treasury's unexpected expansion of long-term Treasury buybacks. Although it is not quantitative easing by the Federal Reserve and will not reduce US government debt, its policy signal reinforced market focus on fiscal pressure and long-end financing costs. Gold thus benefits from a "dual-pathway" boost.
The first pathway is that the buyback policy proves effective.
By buying back 10- to 30-year Treasuries, the Treasury Department improves long-term bond liquidity and eases the upward pressure on yields. If long-term Treasury yields, especially real yields, pull back, the opportunity cost of holding gold—a non-yielding asset—will decline.
Meanwhile, policy intervention may lead the market to expect financial conditions to ease and push the US dollar lower. Because gold is denominated in US dollars, a weakening dollar lowers the cost of buying gold for investors holding other currencies, thereby boosting demand for gold.
The second pathway is that the buyback impact is limited or even fails.
If long-term Treasury yields rise again due to fiscal deficits, debt expansion, interest burdens, and supply-demand imbalances, the market's focus will no longer be on yields themselves, but on the reasons behind their rise. If the increase reflects concerns over US fiscal sustainability, sovereign credit, and the purchasing power of the US dollar, gold will instead benefit as a hedge against sovereign credit risk.
In other words, when yields fall, gold gains from declining opportunity costs; when yields rise due to fiscal risks, gold gains from credit risk premiums and safe-haven demand. Therefore, the Treasury's action to "rescue US Treasuries" instead exposes the vulnerability of long-term bonds needing official backstopping, reinforcing market concerns over "fiscal dominance" and devaluation trades against the US dollar.
It should be noted that inflationary pressures from a rebound in energy prices could still push up rate-hike expectations, exerting periodic constraints on gold's upward trend.
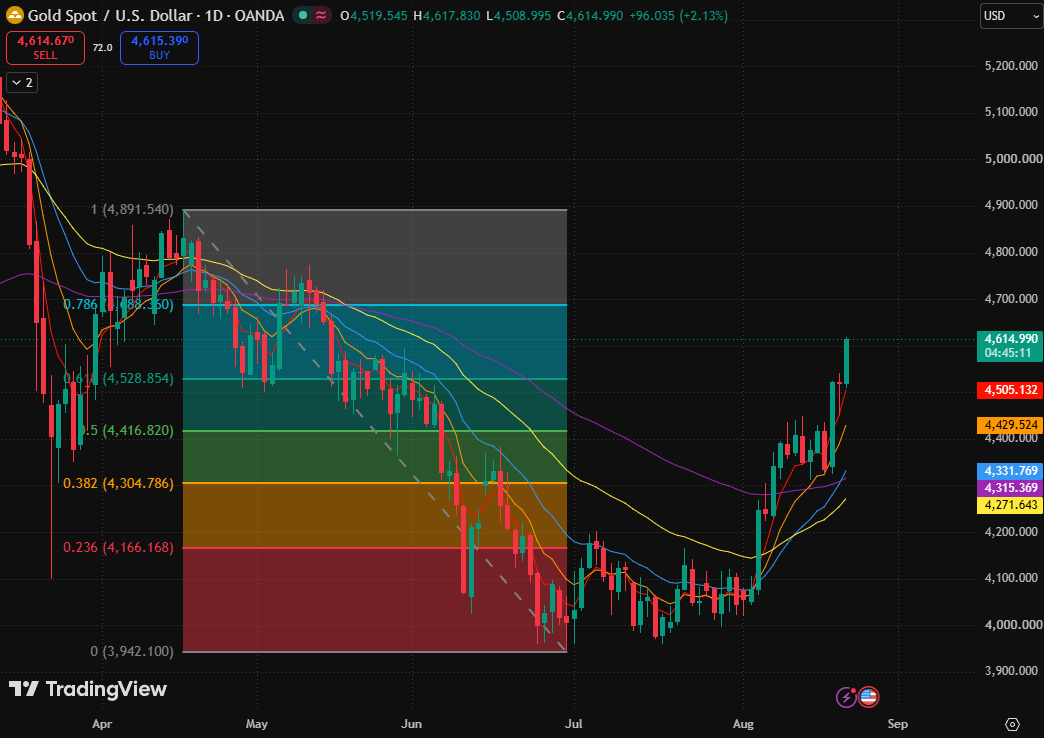
Spot gold candlestick chart, Source: TradingView
Spot gold was last trading at $4,610. The price has effectively broken above the 0.618 Fibonacci retracement level ($4,528.85) as well as the short-, medium-, and long-term moving averages, with the daily chart structure strengthening significantly.
The price is currently near the 0.786 Fibonacci retracement level (around $4,688), entering a rebound resistance confirmation phase, making subsequent pullback confirmations crucial. If a pullback holds above the 5-day moving average ($4,503.67) and the second support at the 0.618 Fibonacci retracement level ($4,528.85), the bullish structure remains intact, opening the door for a further rise toward the previous high of $4,891.54.
If it falls back below the 0.618 Fibonacci retracement level ($4,528.85), the validity of this upside breakout will be questioned; if it further breaks below the 0.5 Fibonacci retracement level ($4,416.82) and the 10-day moving average ($4,428.73), the rebound may turn into a range-bound pullback.
This content was translated using AI and reviewed for clarity. It is for informational purposes only.
Recommended Articles












Comments (0)
Click the $ button, enter the symbol, and select to link a stock, ETF, or other ticker.