

Gold Prices Fall for Four Consecutive Months, Has the Precious Metals Bull Market Partially Ended? Where Is the Next Support Level?


AI Podcast
International gold prices have fallen over 23% year-to-date, with four consecutive months of decline, signaling a technical bear market. This downturn is attributed to stronger-than-expected non-farm payrolls and inflation data, shifting market expectations from rate cuts to hikes. Consequently, U.S. Treasury yields rose, the dollar strengthened, increasing gold's opportunity cost and leading to speculative capital outflows. While short-term technicals suggest a market peak, long-term fundamentals remain robust with central banks, like the PBoC and National Bank of Poland, actively accumulating gold. Key support levels are identified at $4,100 and $4,000, with a prolonged consolidation expected between $4,000-$4,500 until the Fed's policy path clarifies.

TradingKey - Gold Prices ( XAUUSD) Slump for Four Consecutive Months: Has the Precious Metals Bull Market Partially Ended? Where Is the Next Support Level?
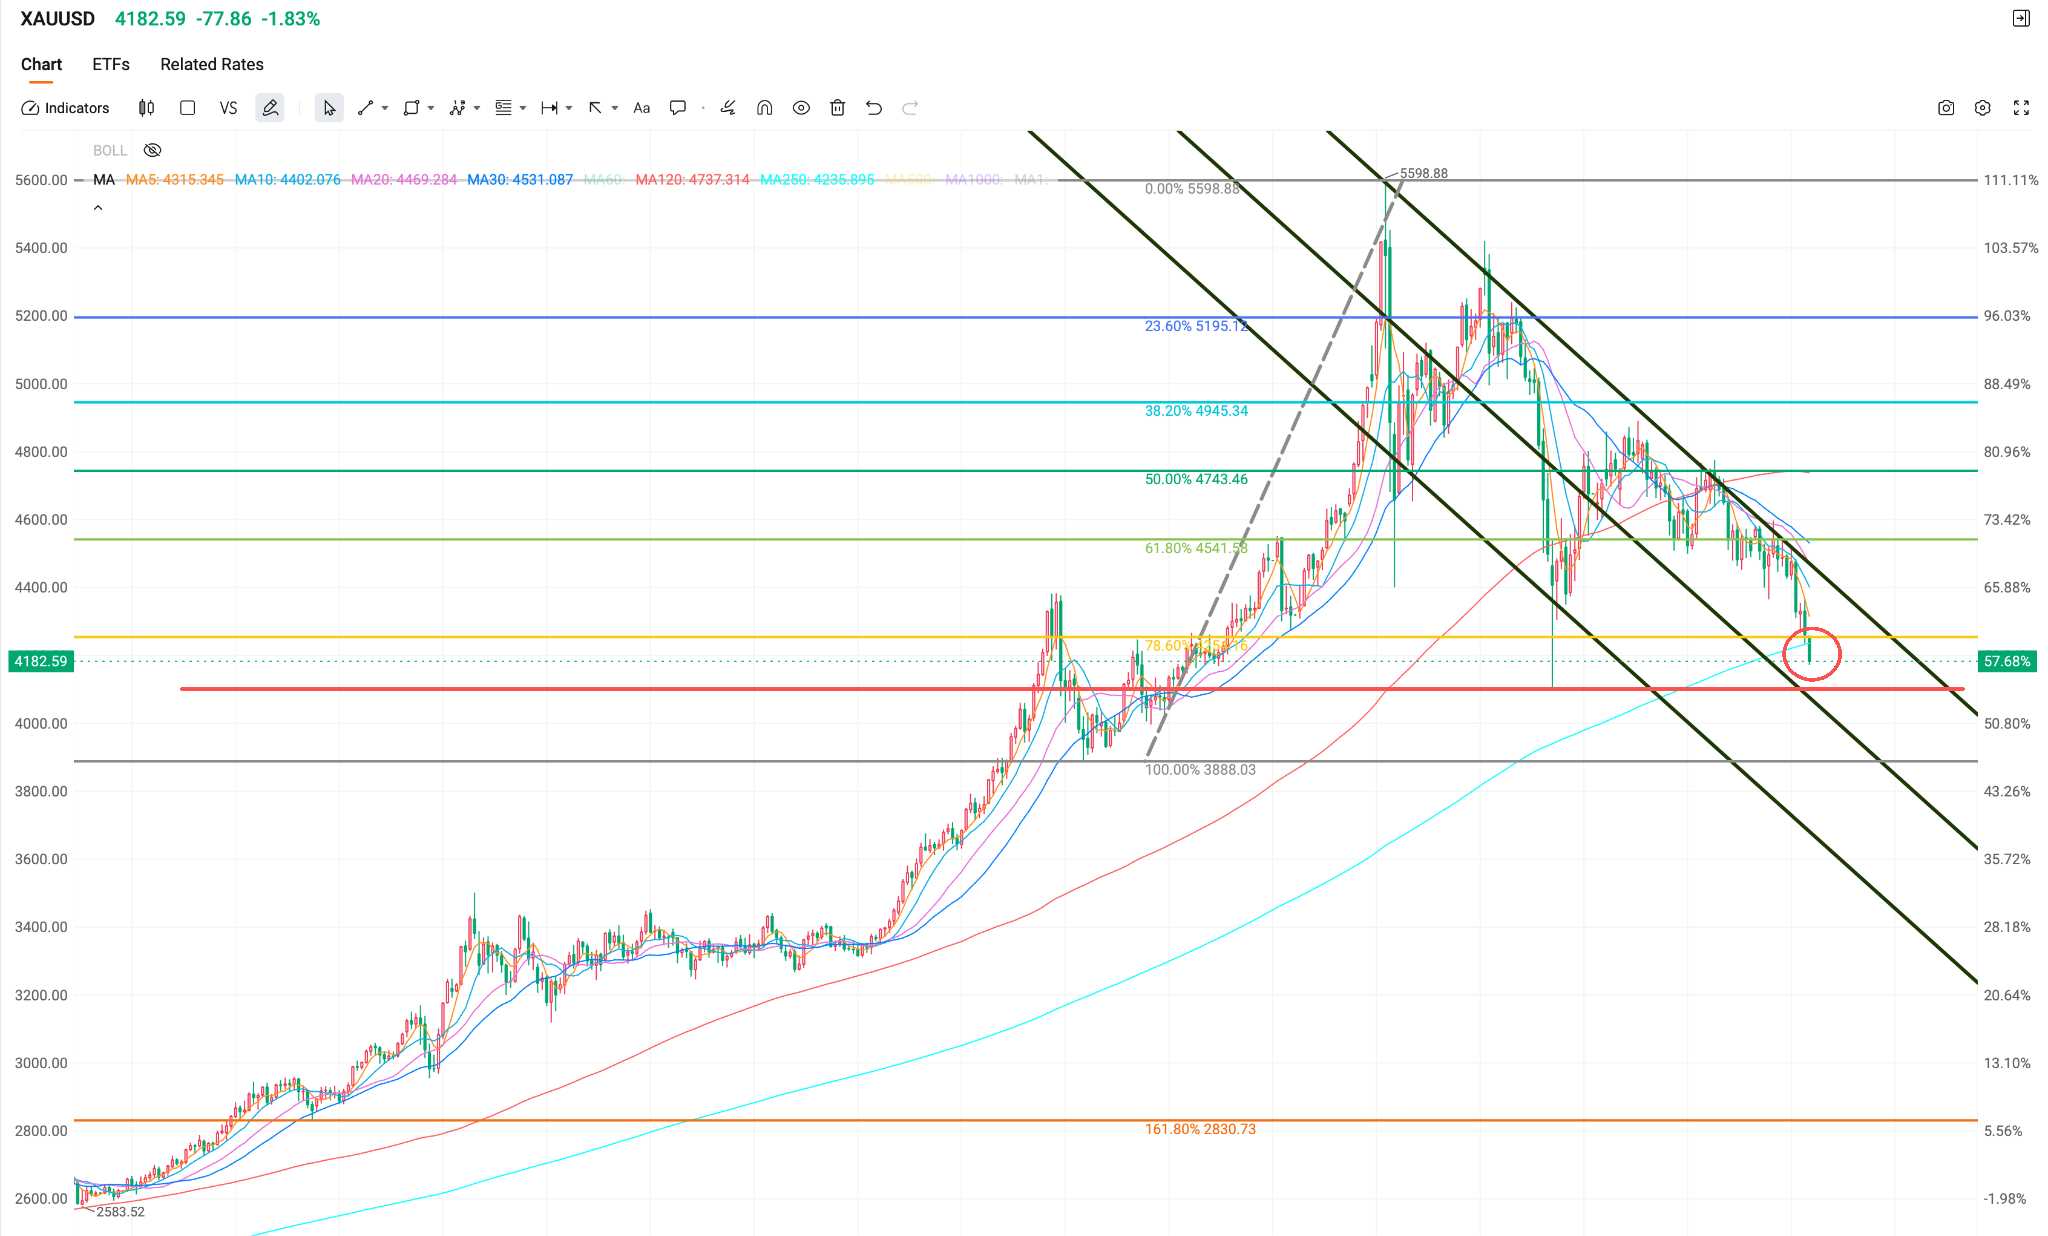
Year-to-date, international gold prices have retreated more than 23% from their record high of $5,598.75/oz, completely erasing all gains for the year. Since peaking at the end of January, gold prices have finished lower for four consecutive months.
In the week of June 5, spot gold recorded its largest weekly drop in nearly three months, falling more than 4%; on June 9, it further broke through the $4,300 mark, satisfying the signals for a technical bear market. The negative correlation logic between the 4.5 USD and gold is resurfacing in an extremely violent manner.
Why are gold prices continuing to fall?
The catalyst for this round of selling was the May non-farm payrolls increasing by 172,000, far exceeding market expectations, with data from the previous two months revised upward by a combined 93,000. Following the release of the data, market bets on a rate hike before year-end jumped from 48% to over 60%, the 10-year U.S. Treasury yield broke above 4.55%, and the U.S. Dollar Index returned to levels above 100.
Higher interest rates directly pushed up the opportunity cost of holding gold; against the backdrop of a significant increase in interest-bearing yields, capital continued to flow out of the gold market, which is a non-yielding asset.
Prior to this, higher-than-expected inflation data—with the April CPI soaring 3.8% year-over-year and the PPI surging 6.0%—had already completely eroded market expectations for a rate cut. Macroeconomic expectations are rapidly pivoting from a rate-cut narrative to a rate-hike narrative.
CFTC data shows that as of May 26, non-commercial net long positions in gold fell to 154,000 contracts, down 39% from the late-January peak and hitting a nearly two-year low. According to World Gold Council data, global physical gold ETFs saw net outflows of $2 billion in May, reversing a five-month trend of net inflows.
Total assets under management (AUM) for gold ETFs have dropped from approximately 325.8 billion yuan at the end of the first quarter to 288.1 billion yuan, a contraction of over 37 billion yuan. Tactical capital is systematically scaling back bets on further appreciation in gold prices.
Has the Bull Market Partially Ended?
From a technical standpoint, the local bull market in precious metals has come to an end. Gold prices have broken below the 250-day moving average for the first time since September 2023. Historically, gold prices tend to decline by approximately 5% further after such a breakdown.
However, the reason it is characterized as a "local" end is that the nature of this decline is more accurately understood as a concentrated exit of speculative capital.
From a long-term perspective, gold's fundamentals remain solid. At the central bank level, the People's Bank of China has increased its gold holdings for 19 consecutive months; as of the end of May, gold reserves rose to 74.96 million ounces, marking the largest single-month increase in nearly 15 months.
The National Bank of Poland led the world in April with net purchases of 14 tons of gold. In terms of long-term capital flows, a European Central Bank report shows that by the end of 2025, gold's share of global central bank reserves had risen to 27%, officially surpassing U.S. Treasuries to become the world's primary reserve asset.
Market analysis indicates that this round of selling was primarily concentrated in long speculative positions built on interest rate cut expectations; marginal shifts in the interest rate outlook forced these funds into stop-loss liquidations. However, "long-term capital" such as central banks has not only refrained from exiting but has actively accumulated positions as gold prices fell. Trading-oriented capital is retreating while strategic capital is increasing—this represents the core structural contradiction in the current gold market.
Where is the next support level?

Analysts warn that if inflation data continues to exceed expectations, the possibility of a direct test of the $4,000 region cannot be ruled out. According to Fibonacci indicators, most valid support levels have been breached, and the market generally expects this retracement to probe the previous 4,100 level; if the 4,100 mark is decisively broken, a retest of the $4,000 handle remains possible.
Key support levels: $4,100, $4,000, $3,888
Meanwhile, some market observers believe that gold prices falling below $4,000 would require a confluence of factors, including a substantive Fed rate hike, a shift by global central banks from gold purchases to selling, and a comprehensive cooling of geopolitical tensions; the probability of these three variables occurring simultaneously is limited in the short term.
Investor Allocation Perspective
For short-term traders, the market is currently in a state of high uncertainty. The upcoming June FOMC meeting will be a key directional catalyst; if expectations for rate hikes continue to strengthen, the high-interest-rate environment will persist in weighing on the short-term valuation of gold, a non-yielding asset.
For long-term allocators, the essence of the divergence lies in the choice of a pricing anchor. If one believes gold's pricing power will shift back to the long-term logic of central bank accumulation and de-dollarization, this pullback of over 20% offers a more favorable margin of safety for positioning compared to early 2026. However, it is worth noting that the current decline has not yet signaled a stabilization; entering in batches at support levels may be the optimal strategy for investors.
The probability of a unilateral downward move remains low, but the likelihood of a prolonged bottoming process at low levels is high. Until the Federal Reserve's policy path becomes clear, gold will likely enter a phase of wide-range consolidation, with $4,000 to $4,500 remaining the mainstream consensus trading range.
This content was translated using AI and reviewed for clarity. It is for informational purposes only.
Recommended Articles


Comments (0)
Click the $ button, enter the symbol, and select to link a stock, ETF, or other ticker.