

Indicators
Indicators
Value
Direction
MACD(12,26,9)
-0.002
Neutral
RSI(14)
52.960
Neutral
STOCH(KDJ)(9,3,3)
26.981
Sell
ATR(14)
0.011
High Vlolatility
CCI(14)
-35.517
Neutral
Williams %R
56.911
Sell
TRIX(12,20)
0.084
Sell
StochRSI(14)
39.047
Buy
1.362USD
Today
+0.59%
5 Days
-0.43%
1 Month
+1.21%
6 Months
+1.35%
Year to Date
+1.08%
1 Year
+9.87%
Opening Price
1.354Previous Closing Price
1.354The Indicators feature provides value and direction analysis for various instruments under a selection of technical indicators, together with a technical summary.
This feature includes nine of the commonly used technical indicators: MACD, RSI, KDJ, StochRSI, ATR, CCI, WR, TRIX and MA. You may also adjust the timeframe depending on your needs.
Please note that technical analysis is only part of investment reference, and there is no absolute standard for using numerical values to assess direction. The results are for reference only, and we are not responsible for the accuracy of the indicator calculations and summaries.
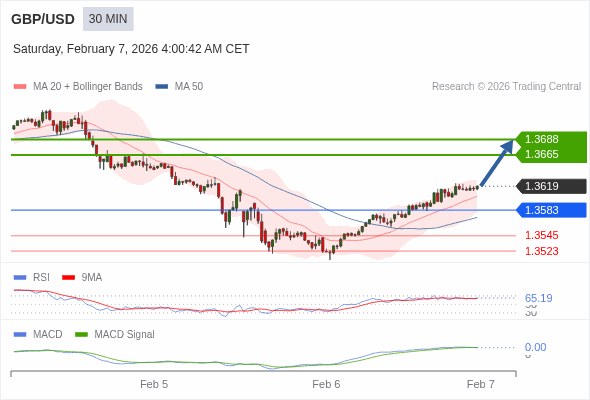
The price could retrace.
below 1.3583, expect 1.3545 and 1.3523.
as long as 1.3583 is support look for 1.3688
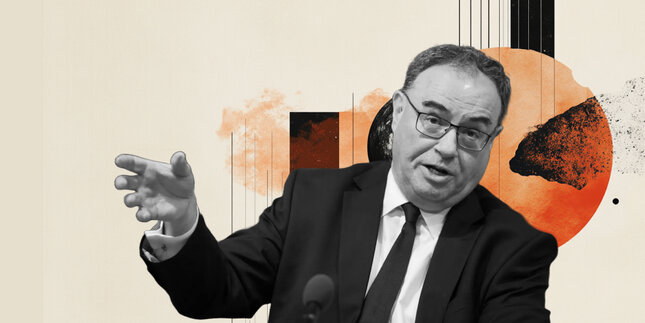
Bank of England (BoE) Governor Andrew Bailey noted that a low-hiring, low-firing environment may persist or quickly shift to a no-hiring, more-firing labor market in a LinkedIn post on Friday
The Pound Sterling recovers on Friday, up by 0.60% as the Greenback makes a U-turn erasing Thursday’s losses amid a risk-on mood. At the time of writing, the GBP/USD trades at 1.3604 yet poised to finish the week with a 0.56% loss.
Lee Hardman from MUFG highlights that the Pound has sold off sharply, with EUR/GBP breaking above its 200-day moving average as markets reprice a more dovish Bank of England path.
Bank of England (BoE) Governor Huw Pill said that there’s a risk that they will draw too much comfort from the dip in inflation that will come in April. He said that they should not overinterpret changes to growth outlook, speaking to businesses on Friday.
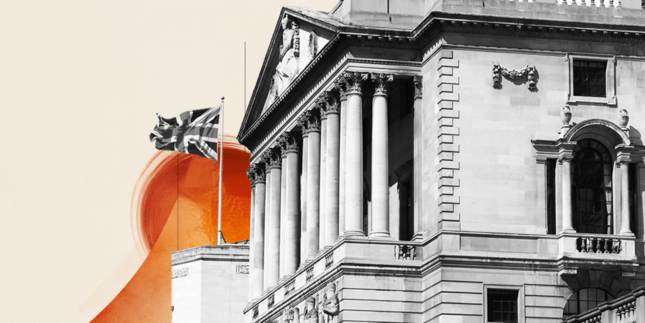
Brown Brothers Harriman (BBH) analysts note GBP/USD has recovered part of its prior drop after a dovish Bank of England hold and heightened UK political uncertainty. The BOE kept rates at 3.75% but lowered the bar for further easing by tweaking guidance and cutting inflation forecasts.

ING's Chris Turner discusses the Bank of England's recent dovish stance, which was unexpected and has shifted market expectations towards potential rate cuts.
Popular Symbols
