優惠


Ripple Price Forecast: XRP fails to reclaim $1.00 despite supply shortage on Binance



- XRP remains range-bound between $0.90 and $1.00 amid broader risk-off sentiment.
- XRP Binance Supply Shortage Index climbs to 2.4, suggesting reduced token availability on the exchange.
- XRP highlights a weak technical structure with a negative MACD and a slightly oversold RSI.
Ripple (XRP) trades around $0.96 on Friday, positioned between the lower range limit at $0.90 and the upper range limit at $1.00. The remittance token recently failed to advance above the critical $1.00 level, leaving bears largely in control. Nonetheless, bulls appear not ready to give up, increasing buy-the-dip activity toward the $0.90 zone.
XRP supply on Binance shrinks
XRP supply conditions on Binance are experiencing a drastic decline, as reflected in the Binance Supply Shortage Index (SSL), which reached 2.4 on Thursday. This figure is notably higher than the 2.09 reading recorded on July 6. Readings above +2.00 indicate tight supply conditions. On the other hand, readings below -1 suggest abundance of supply.
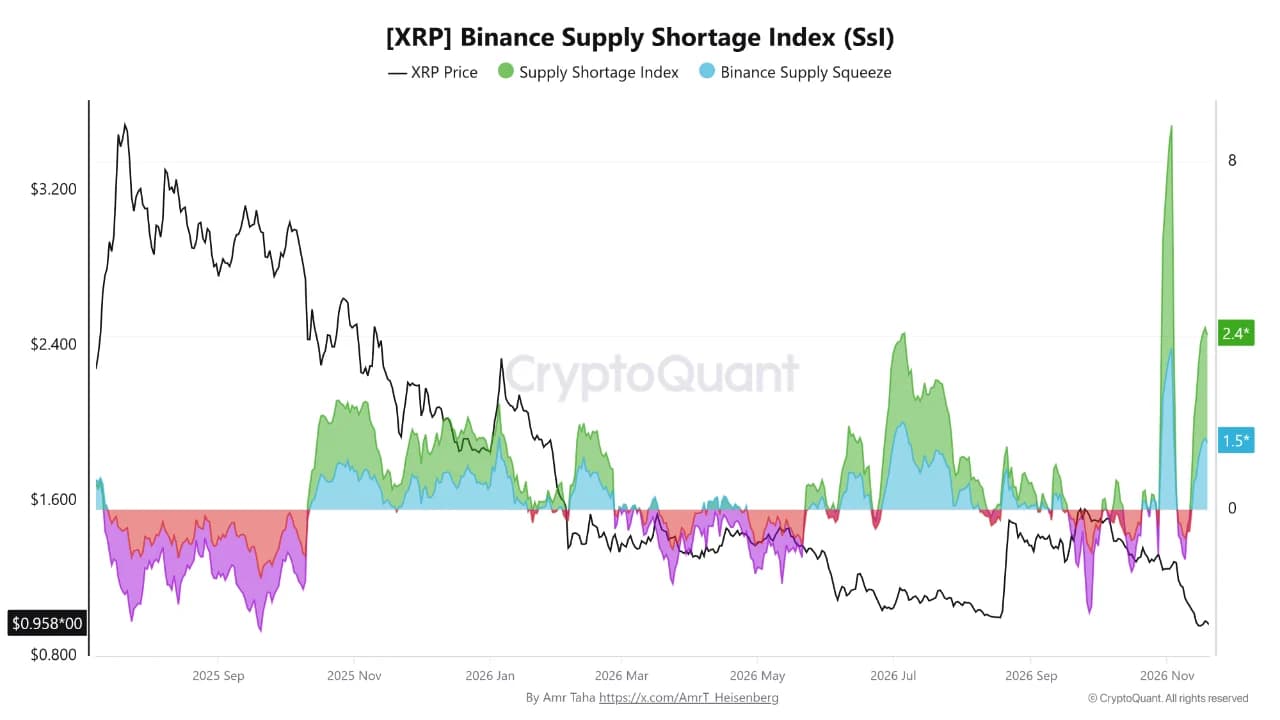
“On September 27, the index stood at -1.5 when XRP traded above $1.50, signaling elevated supply availability on Binance that may have contributed to the subsequent price decline of nearly 40%,” CryptoQuant’s on-chain analyst, Amr Taha, wrote in the platform’s Insights section.
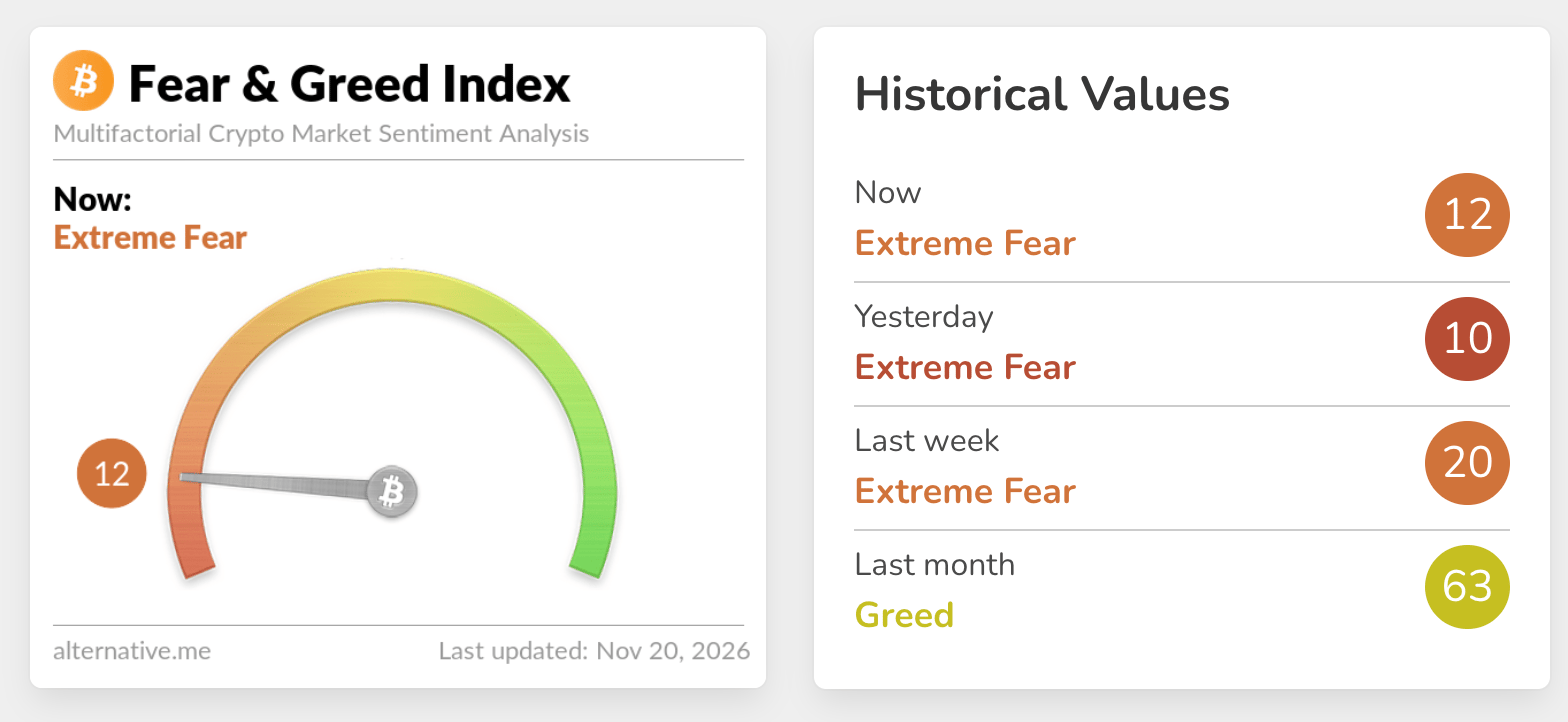
Still, tighter supply is not a bullish indicator on its own, as supply must increase to trigger a sustained price rise. Besides, appetite for crypto assets is significantly low, as shown in the Fear & Greed Index at 12 in the Extreme Fear territory on Friday, up only slightly from 10 in the same range the day before.
Technical analysis: XRP extends sideways trading
XRP trades at $0.96, extending a clear bearish bias as price holds well below the 50-day, 100-day and 200-day Exponential Moving Averages (EMAs) at $1.19, $1.24 and $1.33, respectively. The SuperTrend line at $1.12 also sits overhead, reinforcing a capped structure, while the Relative Strength Index (RSI) at 29 dips into oversold territory and the Moving Average Convergence Divergence (MACD) histogram remains negative, both suggesting persistent but stretched downside momentum rather than an immediate bullish reversal.
Initial resistance lies at the SuperTrend barrier near $1.12, followed by the 50-day EMA around $1.19 and the downward resistance trendline reference at roughly $1.22. Further up, the 100-day EMA near $1.24 and the 200-day EMA around $1.33 form a broader supply zone that would likely cap any deeper corrective bounce while price remains entrenched below these medium and long-term averages.
(The technical analysis of this story was written with the help of an AI tool. Know more.)
Cryptocurrency metrics FAQs
The developer or creator of each cryptocurrency decides on the total number of tokens that can be minted or issued. Only a certain number of these assets can be minted by mining, staking or other mechanisms. This is defined by the algorithm of the underlying blockchain technology. On the other hand, circulating supply can also be decreased via actions such as burning tokens, or mistakenly sending assets to addresses of other incompatible blockchains.
Market capitalization is the result of multiplying the circulating supply of a certain asset by the asset’s current market value.
Trading volume refers to the total number of tokens for a specific asset that has been transacted or exchanged between buyers and sellers within set trading hours, for example, 24 hours. It is used to gauge market sentiment, this metric combines all volumes on centralized exchanges and decentralized exchanges. Increasing trading volume often denotes the demand for a certain asset as more people are buying and selling the cryptocurrency.
Funding rates are a concept designed to encourage traders to take positions and ensure perpetual contract prices match spot markets. It defines a mechanism by exchanges to ensure that future prices and index prices periodic payments regularly converge. When the funding rate is positive, the price of the perpetual contract is higher than the mark price. This means traders who are bullish and have opened long positions pay traders who are in short positions. On the other hand, a negative funding rate means perpetual prices are below the mark price, and hence traders with short positions pay traders who have opened long positions.