優惠


Crypto Today: Bitcoin risks breaking below $61K as Ethereum corrects while XRP consolidates



- Bitcoin trades under bearish pressure on Friday, with a deeper correction below $60,000 potentially on the horizon.
- Ethereum bears tighten their grip as the token extends losses below $1,800.
- XRP holds relatively stable amid the broader bearish backdrop, consolidating in a range between $0.90 and $1.00.
The cryptocurrency market is trying to stabilize amid broader selling pressure, with Bitcoin (BTC) hovering below $62,000 on Friday. The Crypto King’s recovery attempts this week have failed to gain traction, leaving sellers largely in control.
Altcoins, including Ethereum (ETH) and Ripple (XRP), send mixed signals, signaling varied repositioning among investors. The smart contract token, ETH, for instance, has deepened its correction below $1,800. Meanwhile, XRP continues to trade sideways in a narrow $0.90-$1.00 range.
“Crypto markets have offered little shelter. Bitcoin slipped toward $61,000-$62,000, losing approximately 13% over the past week, while Ethereum traded around 41,700-1,800,” Crypto Finance said in an emailed analysis report.
Risk-off sentiment persists
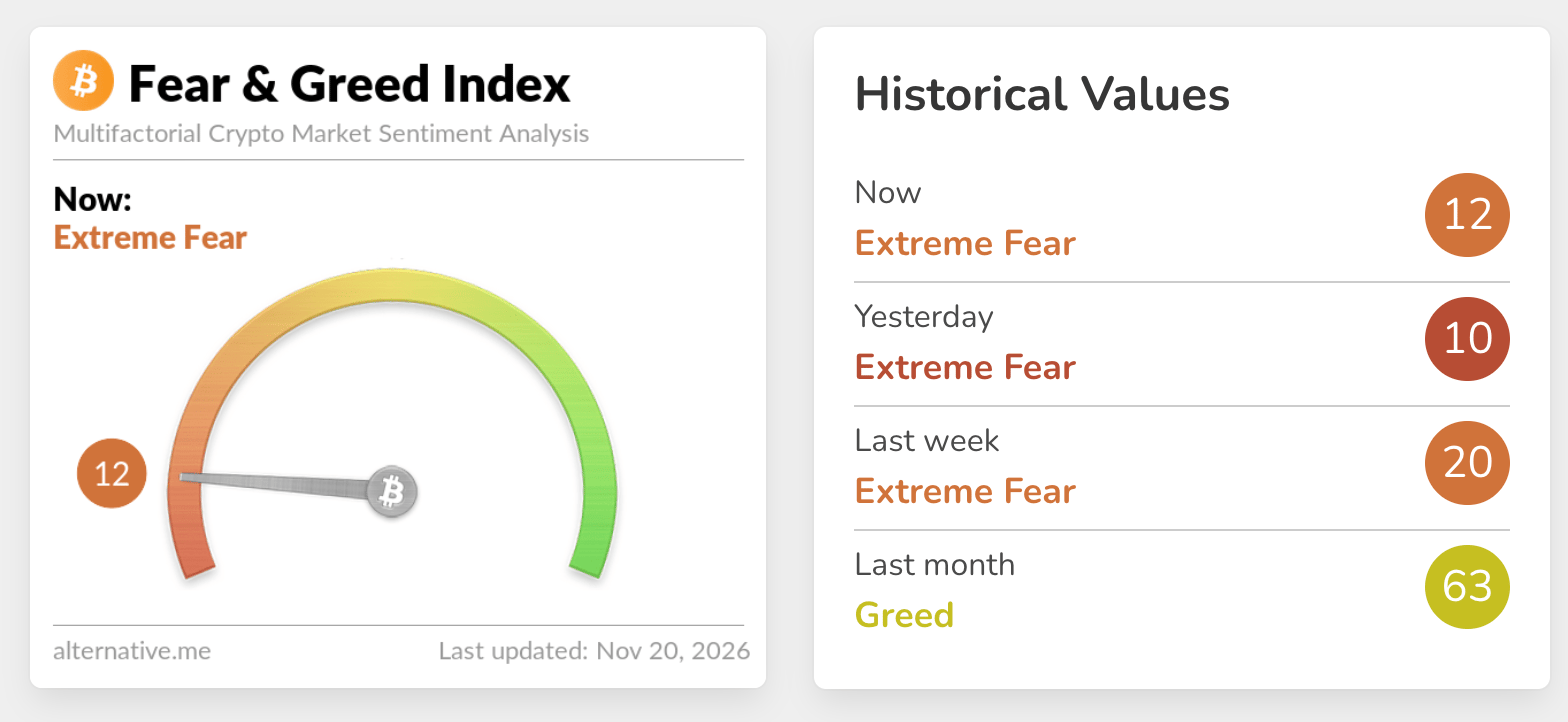
Appetite for crypto-related assets is fading, as reflected in the Fear & Greed Index at 12 in the Extreme Fear territory on Friday, up only marginally from 10 in the same range the previous day. This configuration reinforces the lack of interest in the crypto market, as investors deliberately retreat to the sidelines, perhaps until stability is established.
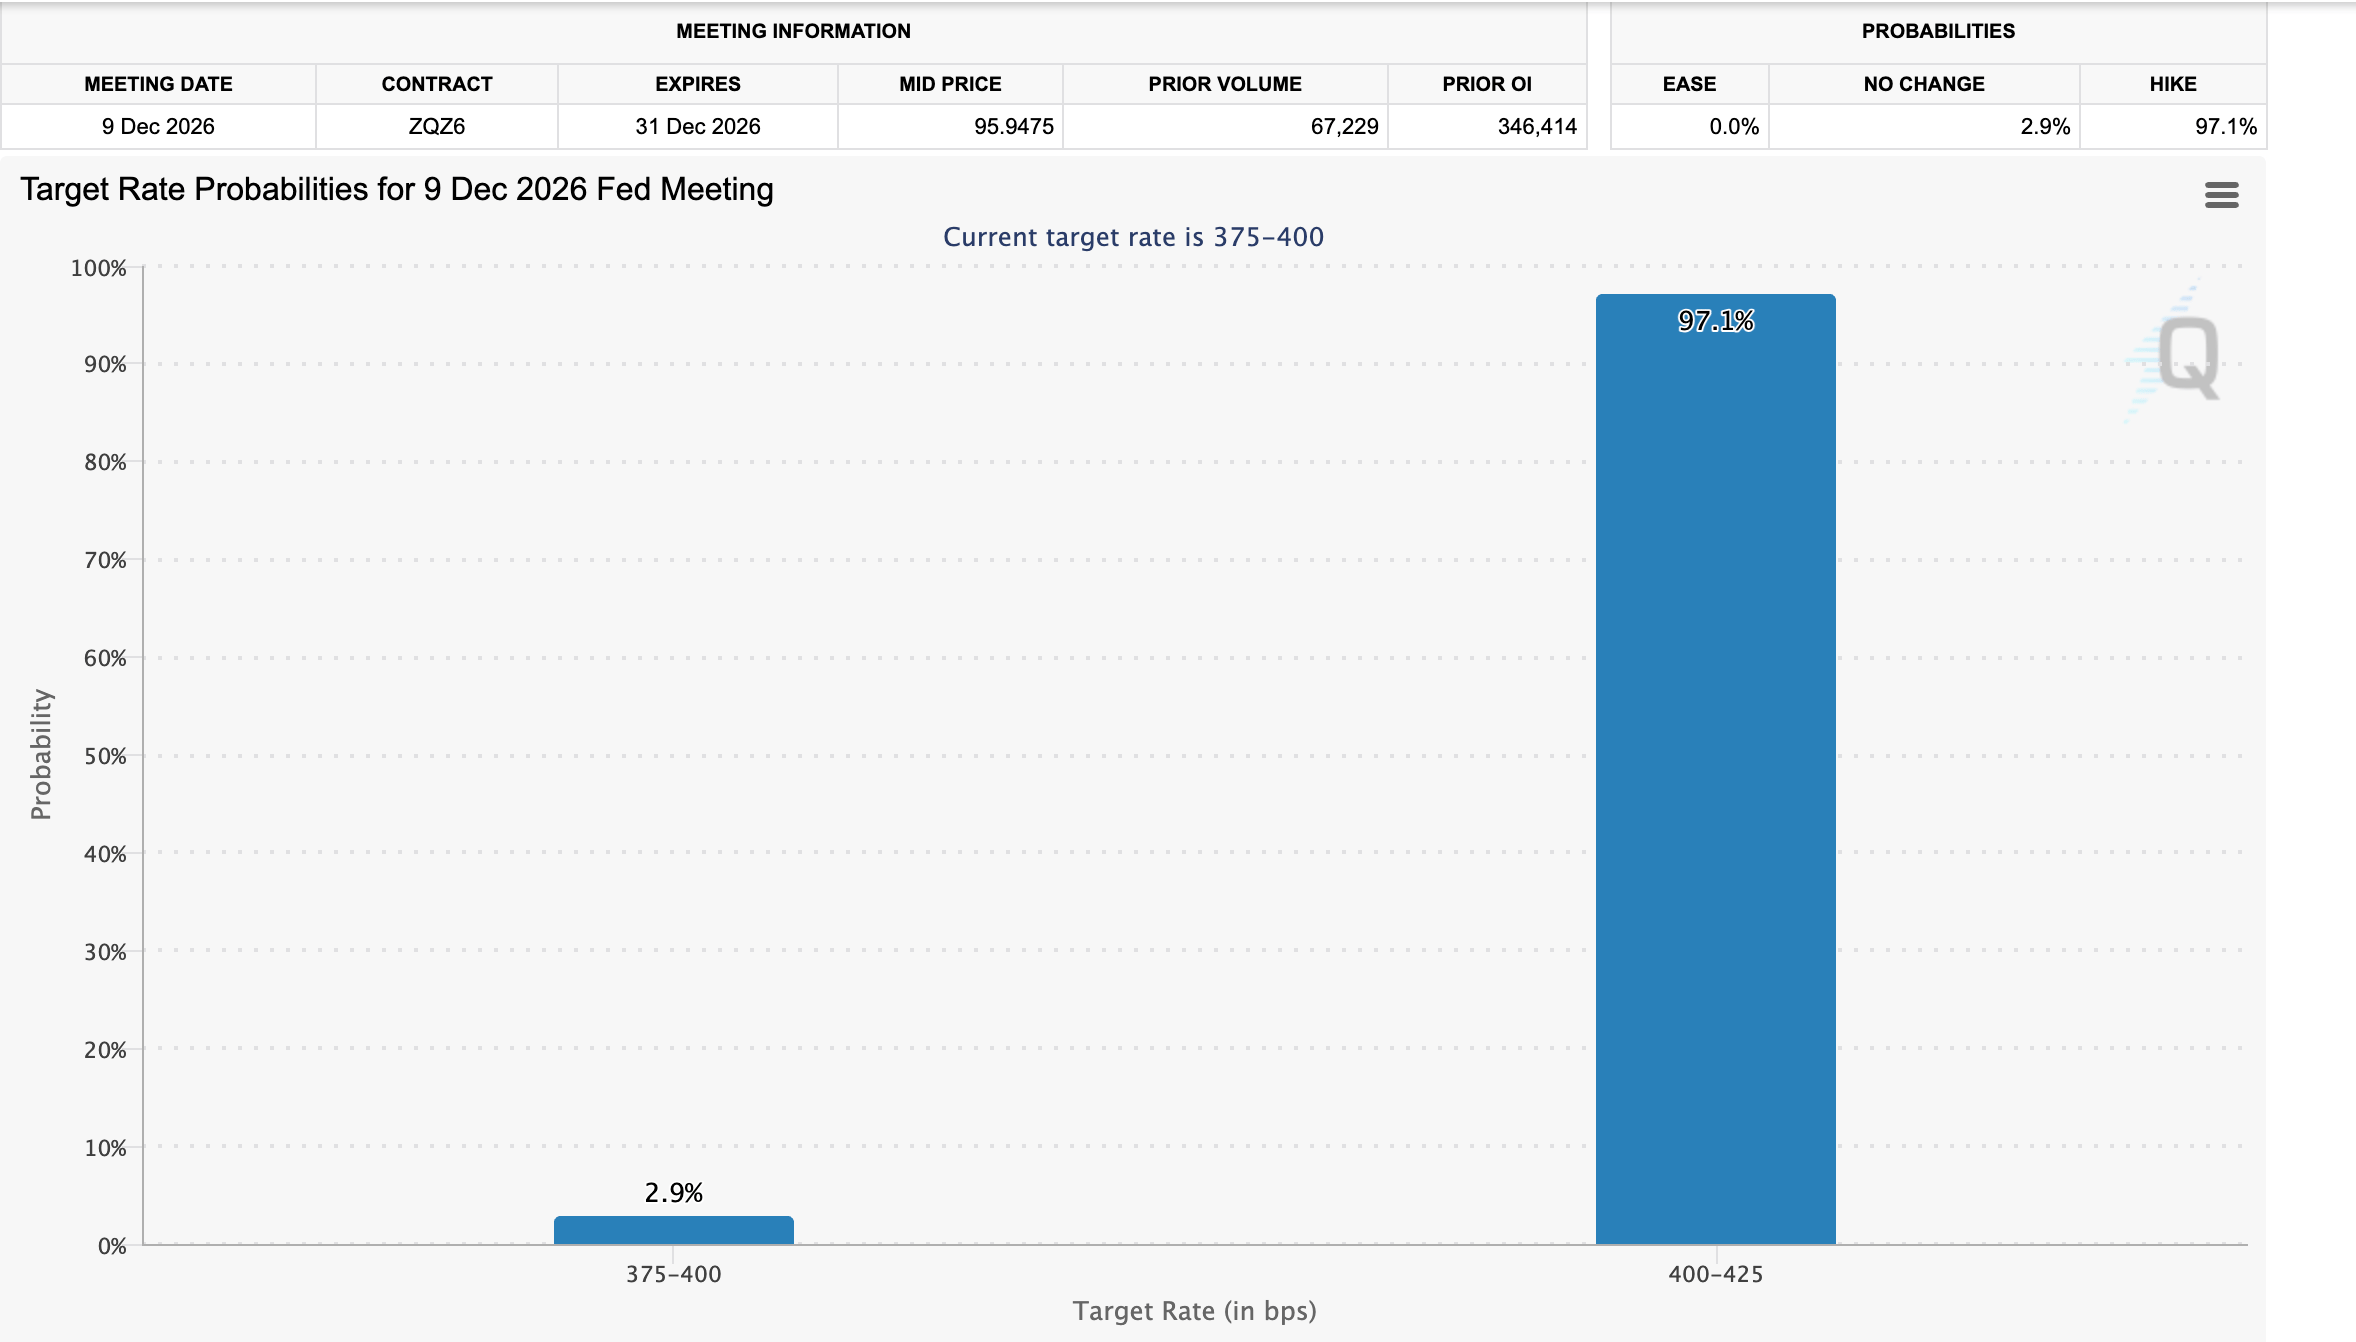
However, the upcoming Federal Reserve (Fed) interest rate decision in December drives traders on edge, with market participants increasingly betting at 97% that the central bank will hike rates. The decision on December 9 could raise interest rates in the United States (US) to the 4.00-4.25% range, impacting risk assets. Investors tend to gravitate toward more stable assets such as US Treasuries, negating risk-on rotation into crypto assets.
“The Fed is growing increasingly concerned about inflation. Minutes from its October meeting highlighted the rapid expansion of debt financing for Artificial Intelligence (AI) infrastructure, alongside concerns about potentially disappointing investment returns,” Crypto Finance added in the report.
Technical analysis: Bitcoin risks deeper losses
Bitcoin trades at $61,843, extending its slide well below all key Exponential Moving Averages (EMAs) and keeping the near-term bias decisively bearish. Price holds under the 50-day EMA at $74,655, the 100-day EMA at $75,430 and the 200-day EMA at $75,653, illustrating a firmly capped structure where any rebounds would likely face selling pressure into these overhead trends.
Momentum conditions remain weak, with the Relative Strength Index at 20, deep in oversold territory and the Moving Average Convergence Divergence (MACD) line entrenched in negative territory, reinforcing persistent downside pressure despite the risk of intermittent short-covering bounces.
Initial resistance emerges at the 50-day EMA near $74,655, followed by the 100-day EMA at $75,430 and the 200-day EMA at $75,653, forming a dense supply zone that would need to be reclaimed to ease the current bearish tone. With no nearby technical support derived from the provided indicators on the daily chart, traders are left to watch price action itself for signs of stabilization, while the combination of oversold RSI and negative but stretched MACD hints that any recovery attempts are likely to be corrective within a still-dominant downtrend as long as the pair remains pinned beneath the EMA cluster.
Ethereum technical analysis: ETH remains firmly in bearish hands
Ethereum trades at $1,754, keeping a clear bearish bias as price holds well beneath the 50-day, 100-day and 200-day EMAs clustered between roughly $2,189 and $2,271. The MACD remains negative, with its latest reading well below zero, while the RSI sits in oversold territory near 23, suggesting persistent downside momentum despite already stretched conditions.
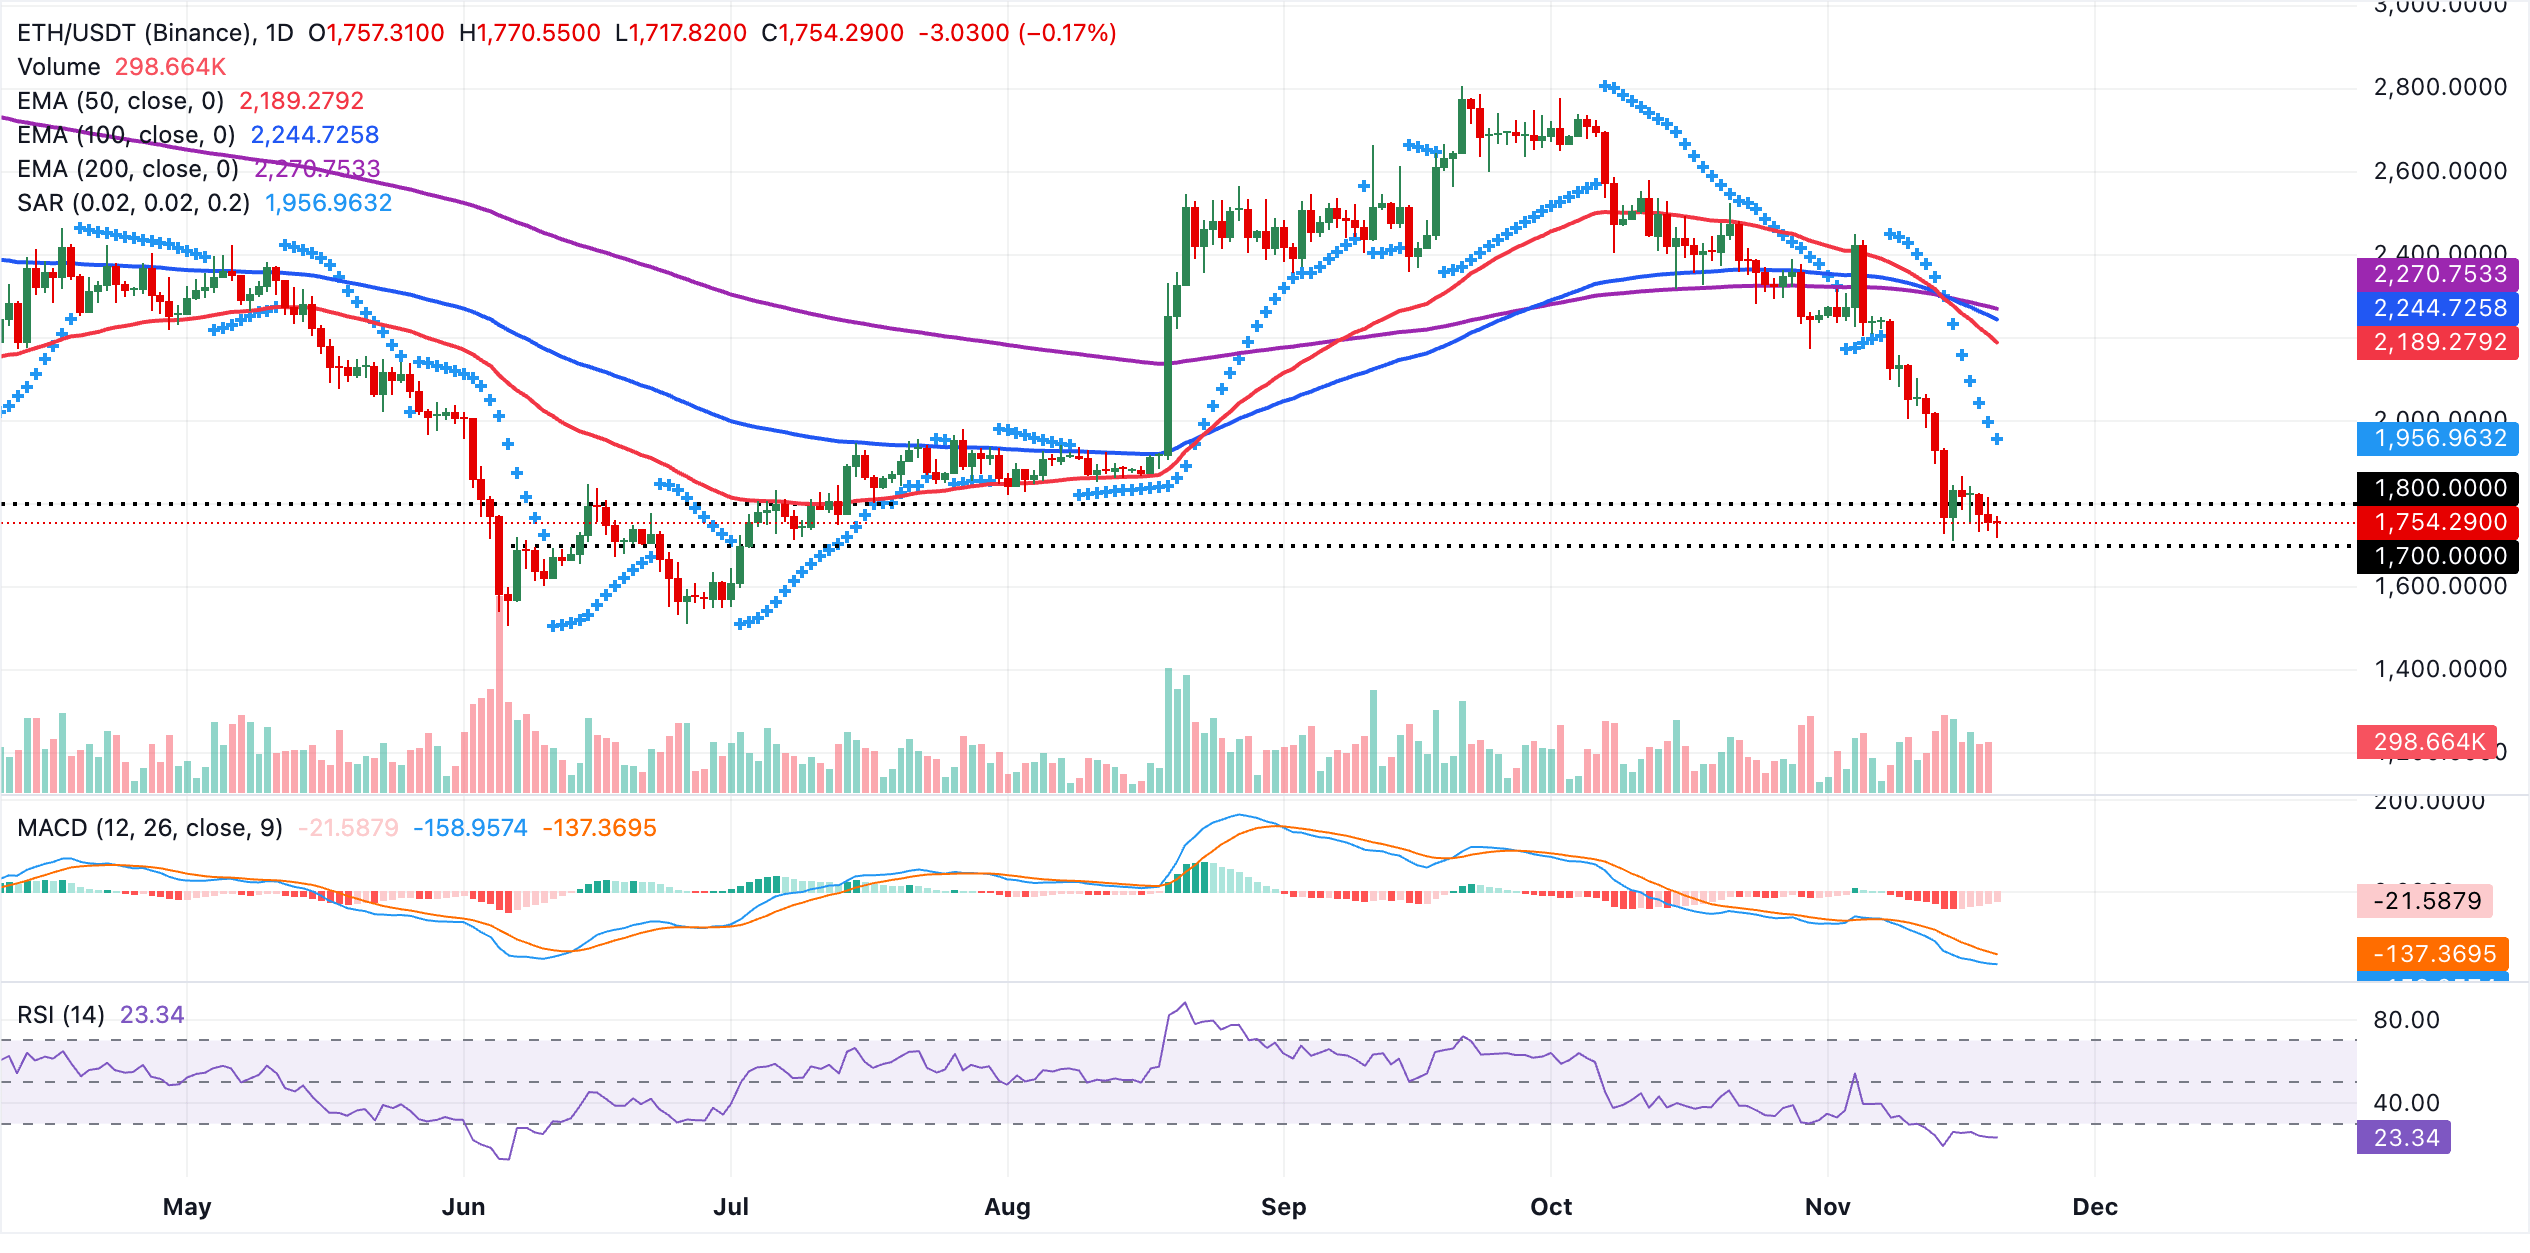
Initial resistance lies at the 50-day EMA near $2,189, ahead of the 100-day EMA at $2,244 and the 200-day EMA around $2,271, which together define a broad supply zone that would need to be reclaimed to ease downside pressure. On the downside, the next notable technical support is indicated by the Parabolic SAR around $1,957, where sellers could pause or take profit if the decline extends.
Technical analysis: XRP sustains sideways action
XRP trades near $0.97, extending a bearish bias as price holds well below the 50-day, 100-day and 200-day EMAs, which cluster between roughly $1.19 and $1.33 and frame a firmly capped medium-term structure.
The SuperTrend indicator at $1.12 also sits above spot, reinforcing overhead pressure, while the RSI near 30 suggests conditions are edging out of oversold territory without yet signaling a decisive recovery, and the MACD remains slightly negative but hints at waning downside momentum as its line grinds higher toward the signal line.
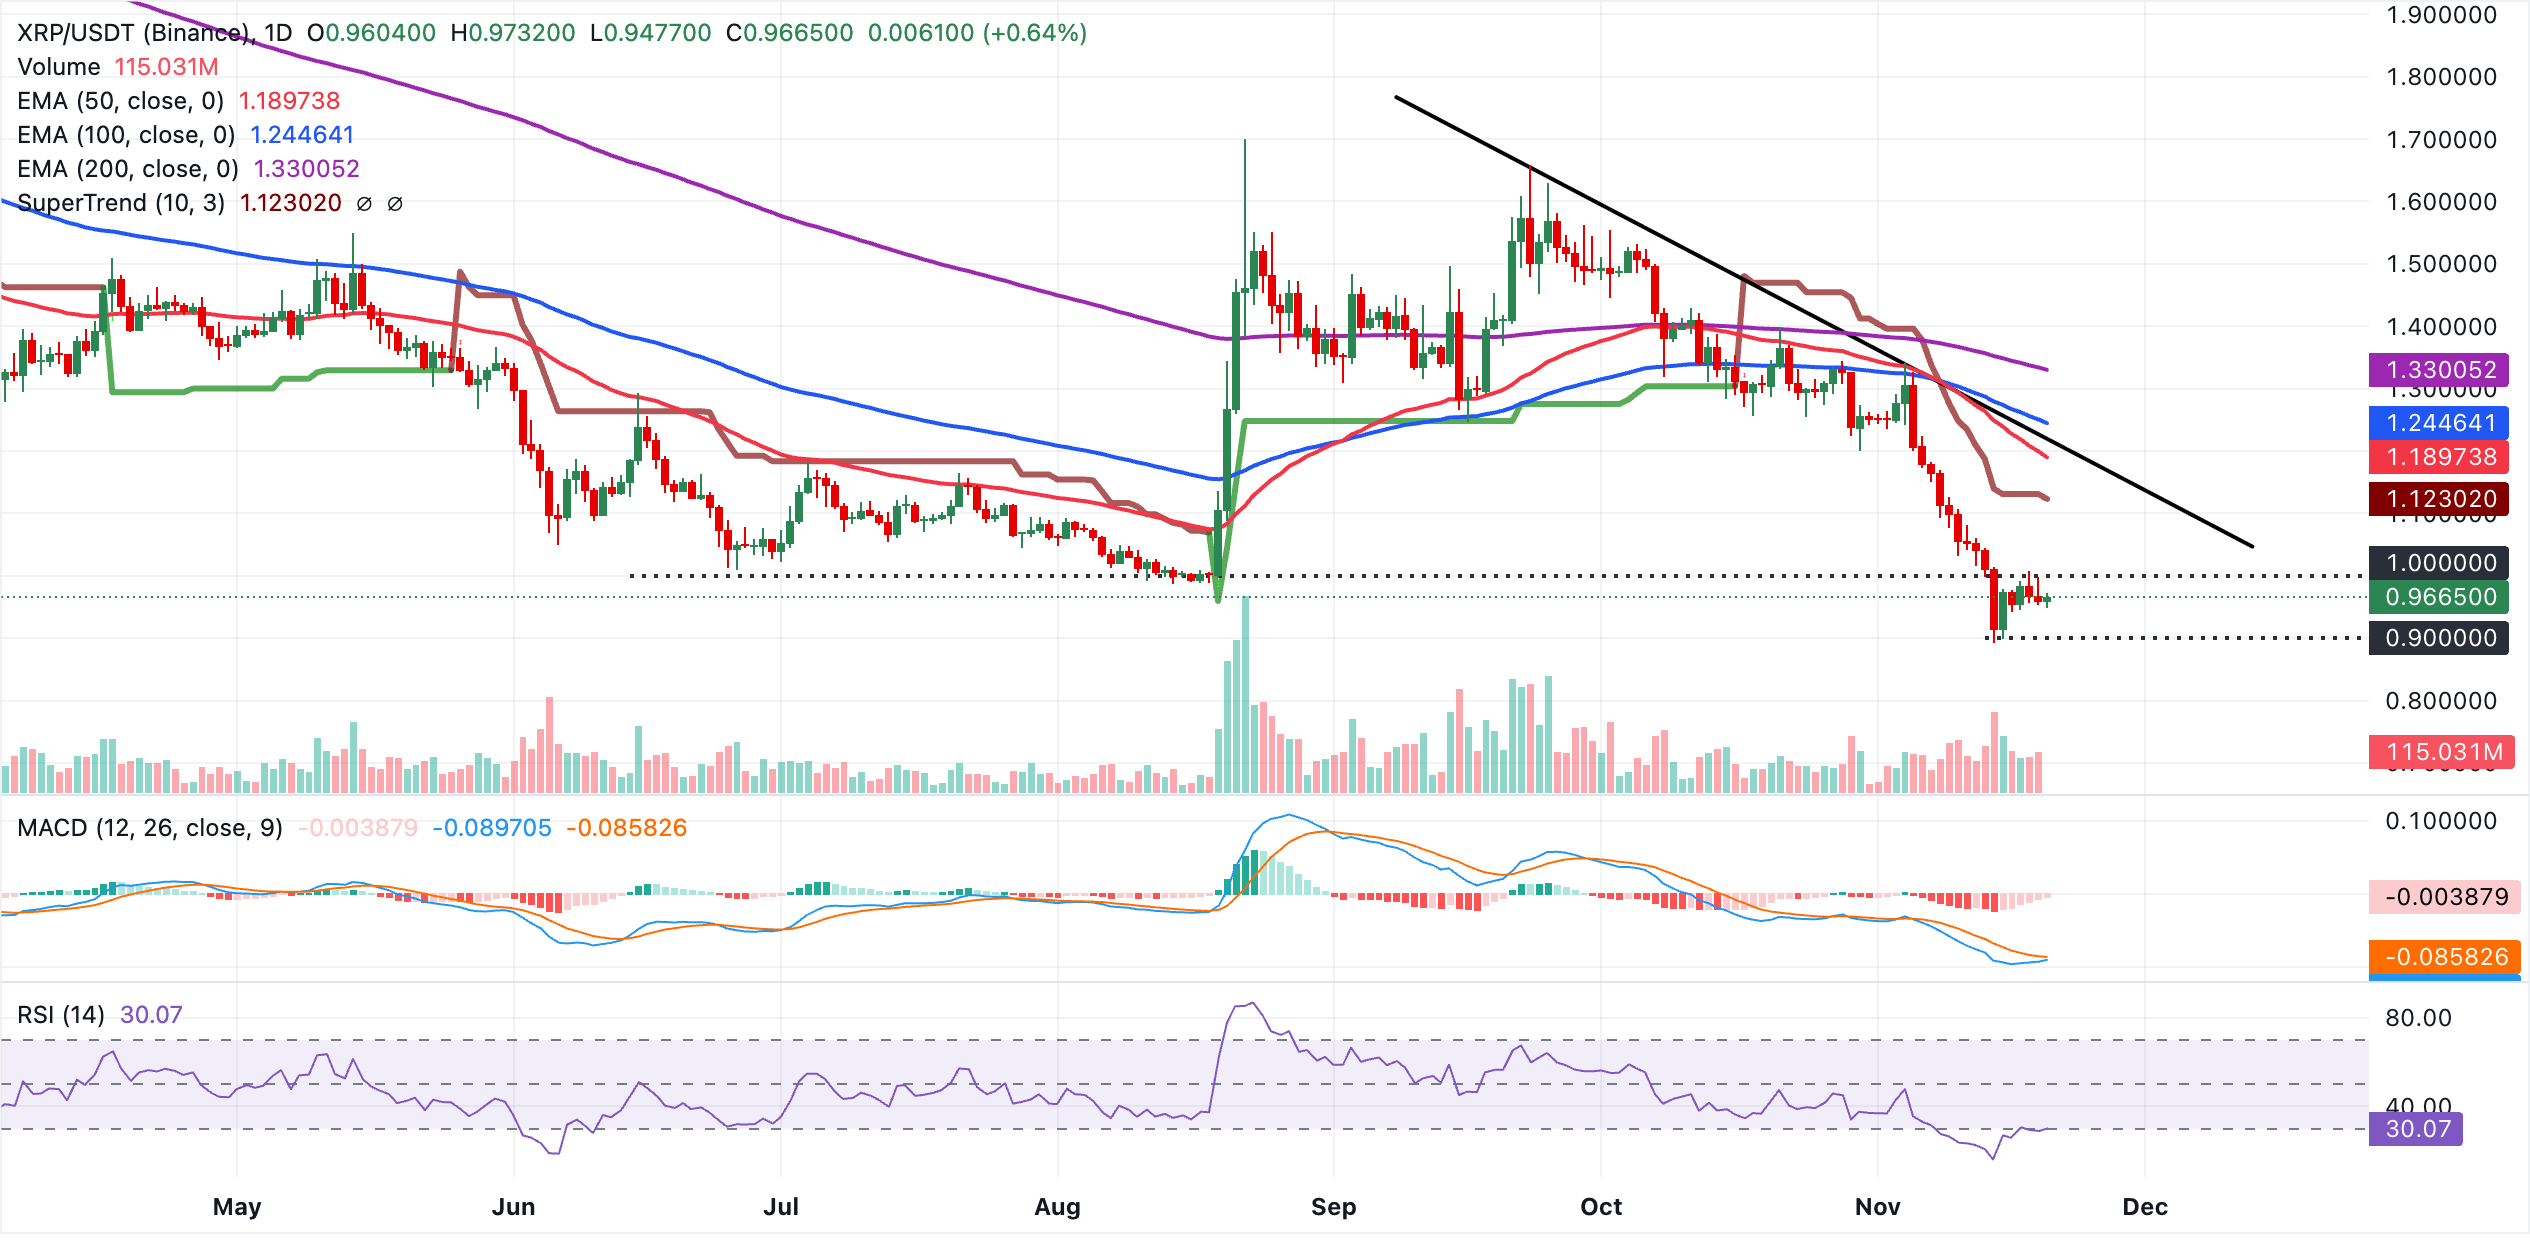
Initial resistance lies at the SuperTrend level around $1.12, with further hurdles at the 50-day EMA near $1.19 and the downward resistance trendline projected around $1.22, before the 100-day EMA at $1.24 and the 200-day EMA close to $1.33 come into play as broader bearish markers.
With no clear technical support derived from moving averages or structural levels on the daily chart, any attempted rebound is likely to be treated as a corrective bounce while price remains below this dense ceiling of daily resistance indicators.
(The technical analysis of this story was written with the help of an AI tool. Know more.)
Cryptocurrency prices FAQs
Token launches influence demand and adoption among market participants. Listings on crypto exchanges deepen the liquidity for an asset and add new participants to an asset’s network. This is typically bullish for a digital asset.
A hack is an event in which an attacker captures a large volume of the asset from a DeFi bridge or hot wallet of an exchange or any other crypto platform via exploits, bugs or other methods. The exploiter then transfers these tokens out of the exchange platforms to ultimately sell or swap the assets for other cryptocurrencies or stablecoins. Such events often involve an en masse panic triggering a sell-off in the affected assets.
Macroeconomic events like the US Federal Reserve’s decision on interest rates influence crypto assets mainly through the direct impact they have on the US Dollar. An increase in interest rate typically negatively influences Bitcoin and altcoin prices, and vice versa. If the US Dollar index declines, risk assets and associated leverage for trading gets cheaper, in turn driving crypto prices higher.
Halvings are typically considered bullish events as they slash the block reward in half for miners, constricting the supply of the asset. At consistent demand if the supply reduces, the asset’s price climbs.