Dogecoin Price Forecast: Rebound gains traction as bulls target key resistance trendline



- Dogecoin holds steady above $0.0770 on Thursday, after a rebound of over 2% the previous day.
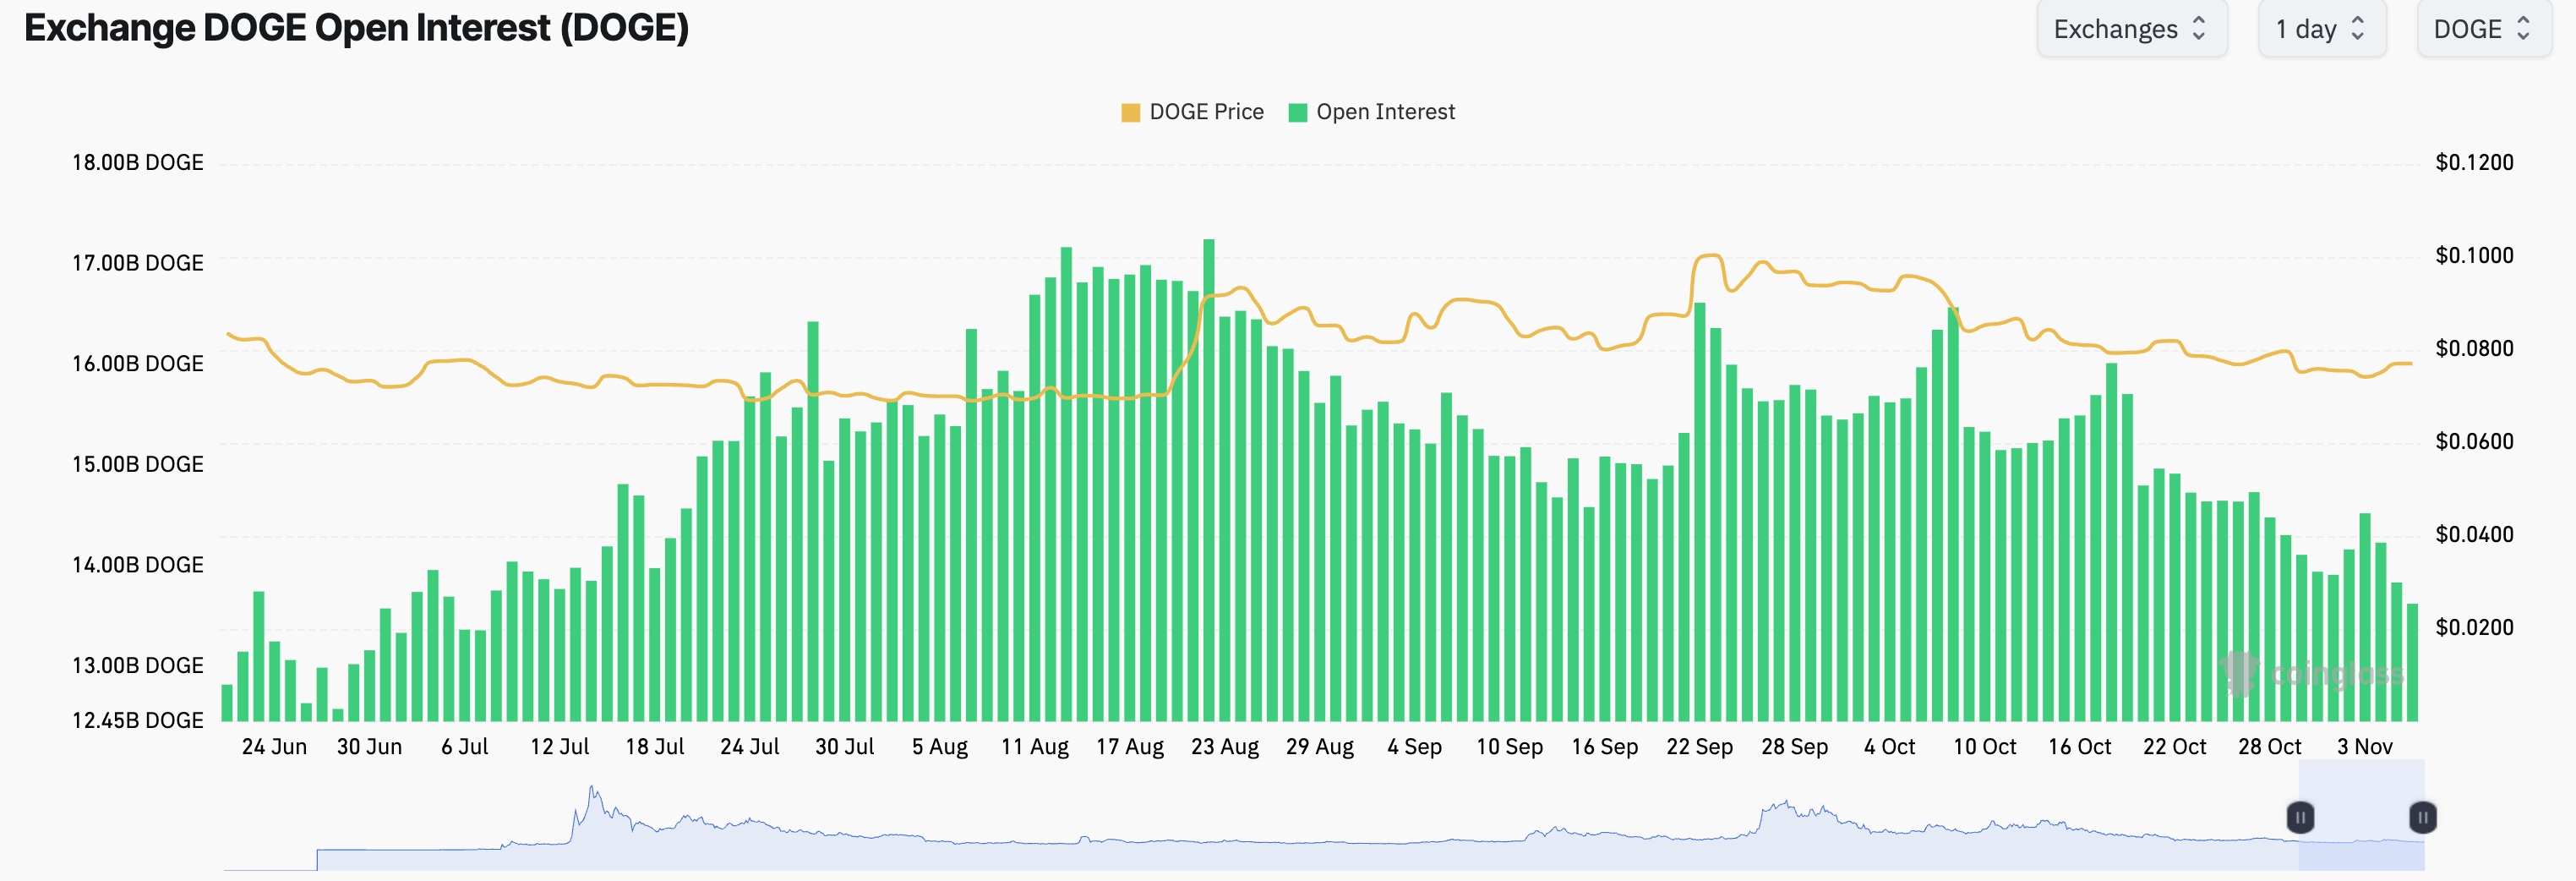
- Declining DOGE Open Interest suggests reduced leveraged activity while institutional investors go silent for the third week.
- The technical outlook for DOGE suggests a potential bullish breakout of a key resistance trendline on the four-hour chart.
Dogecoin (DOGE) shows signs of recovery, hovering above $0.0770 on Thursday after two consecutive days of gains. The meme coin gains traction despite muted appeal from institutional investors and declining Open Interest. The technical outlook for DOGE suggests an upside bias as the recovery gains traction, hinting at a potential bullish breakout of a key resistance trendline on the four-hour chart.
The appeal for DOGE is fading
Meme coins often lose their appeal among investors at the slightest hint of headwinds. Dogecoin, the original meme coin, faces similar challenges, with institutional and leverage-taking investors waiting on the sidelines.
CoinGlass data shows that DOGE futures Open Interest (OI) is down to 13.62 billion DOGE from 14.52 billion on Monday, despite the rising spot price. This suggests positional unwinding as the traders are unwilling to take risks in DOGE.
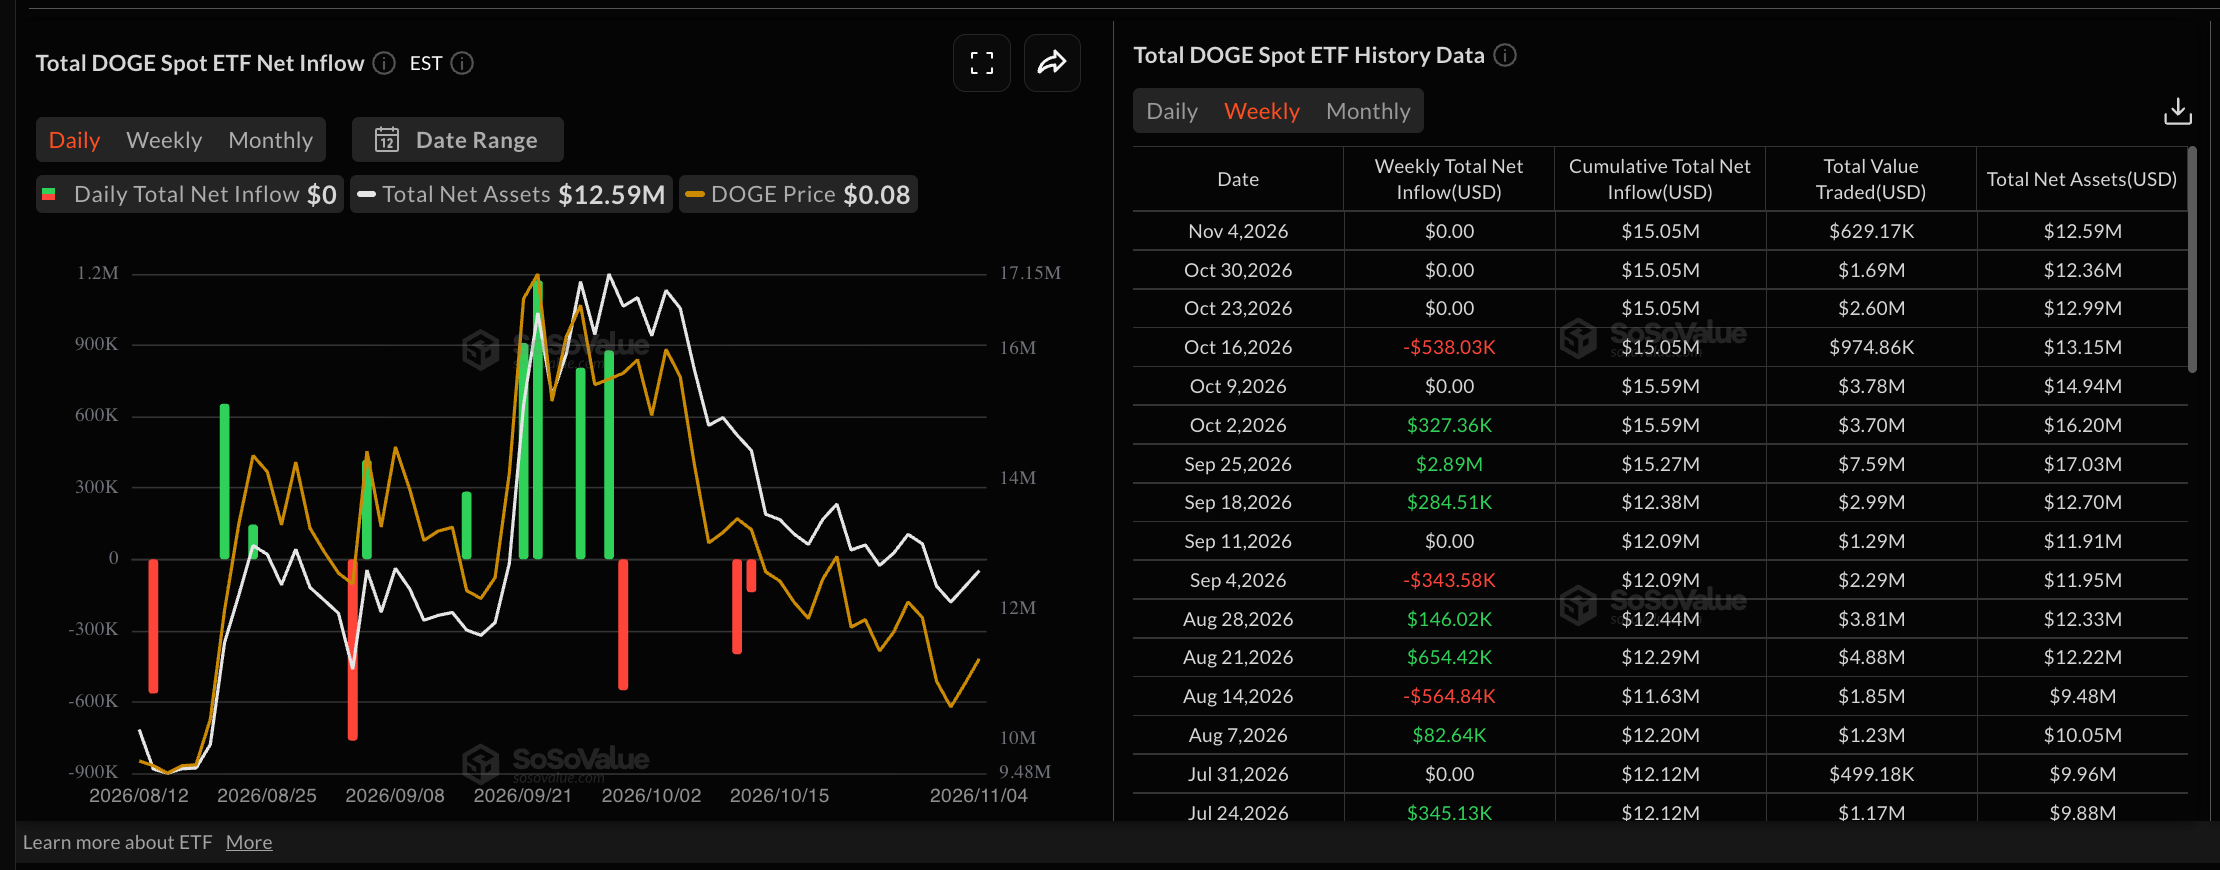
On the other hand, Dogecoin Exchange-Traded Funds (ETFs) have recorded zero inflows since October 14, stepping into their third muted week. This silence mirrors the similar subdued risk appetite from the derivatives market, despite the near-term recovery.
However, if the ongoing recovery in DOGE holds steady, it could attract derivatives traders, followed by institutional investors as the broader crypto market sentiment recovers after Democrats swept the US midterm elections.
Technical outlook: Bullish rebound in DOGE flags breakout chances
Dogecoin trades near $0.0772 at press time on Thursday, sustaining its over 2% rebound from the previous day.
DOGE reclaims the 50-period Exponential Moving Average (EMA) at $0.0762 on the four-hour chart but remains capped below a long-term resistance trendline connecting the October 8 and 29 highs, near $0.0786. A confirmed breakout above $0.0786 could target the 200-period EMA, clustered with horizontal resistance, at $0.0806.
Momentum on the four-hour chart remains constructive, as the Relative Strength Index (RSI) hovers near 58 while the Moving Average Convergence Divergence (MACD) line remains marginally positive.
On the downside, initial support is provided by the 50-period EMA at $0.0762. A sustained break below this floor would expose the horizontal base at $0.0723, with a deeper bearish extension potentially targeting the lower support zone near $0.0677.
(The technical analysis of this story was written with the help of an AI tool. Know more.)