優惠


Gold buyers remain cautious amid prospects of faster Fed rate hikes



- Gold steadies after a sharp sell-off as the US Dollar retreats from a 19-month high.
- An increasingly hawkish Fed outlook continues to weigh on Gold.
- Technical indicators remain bearish, with RSI near oversold territory.
Gold (XAU/USD) trades flat on Thursday after briefly slipping below $3,700 in early Asian trade, its lowest level since September 2025. A pullback in the US Dollar (USD) eases some of the selling pressure on the metal after Wednesday’s 3.19% drop.
At the time of writing, XAU/USD trades around $3,731. The US Dollar Index (DXY), which tracks the Greenback against a basket of six major currencies, trades around 103.60 after touching a 19-month high of 103.96 earlier in the day.
Buying interest in Gold remains subdued as expectations grow that the Federal Reserve (Fed) could raise interest rates at a faster pace to rein in inflation. Traders have fully priced in a December rate hike and expect further increases in the first quarter of 2027, according to the CME FedWatch Tool.
The minutes of the Fed’s October meeting, released on Wednesday, reinforced those expectations. A couple of officials said the Fed could consider a hike of more than 25 basis points (bps) in December if incoming inflation data prove unfavourable. A few participants observed that inflation could prove more persistent than expected, in which case a shift to a more restrictive policy stance could become necessary.
The Fed raised its policy rate by 25 bps to 3.75%-4.00% in September before holding it steady in October. Inflation data released since then have come in hotter than expected. That, along with hawkish remarks from Fed officials in recent days, has strengthened expectations of further tightening and led some traders to bet on a larger 50 bps hike in December.
Against this backdrop, the US Dollar’s downside could remain limited, with Treasury yields still elevated. A firmer Dollar makes Gold more expensive for buyers using other currencies, while higher yields reduce the appeal of holding the metal because it pays no interest. Traders now turn to US weekly jobless claims and remarks from Fed officials for fresh clues on the policy outlook.
Technical Analysis: Momentum indicators favour sellers
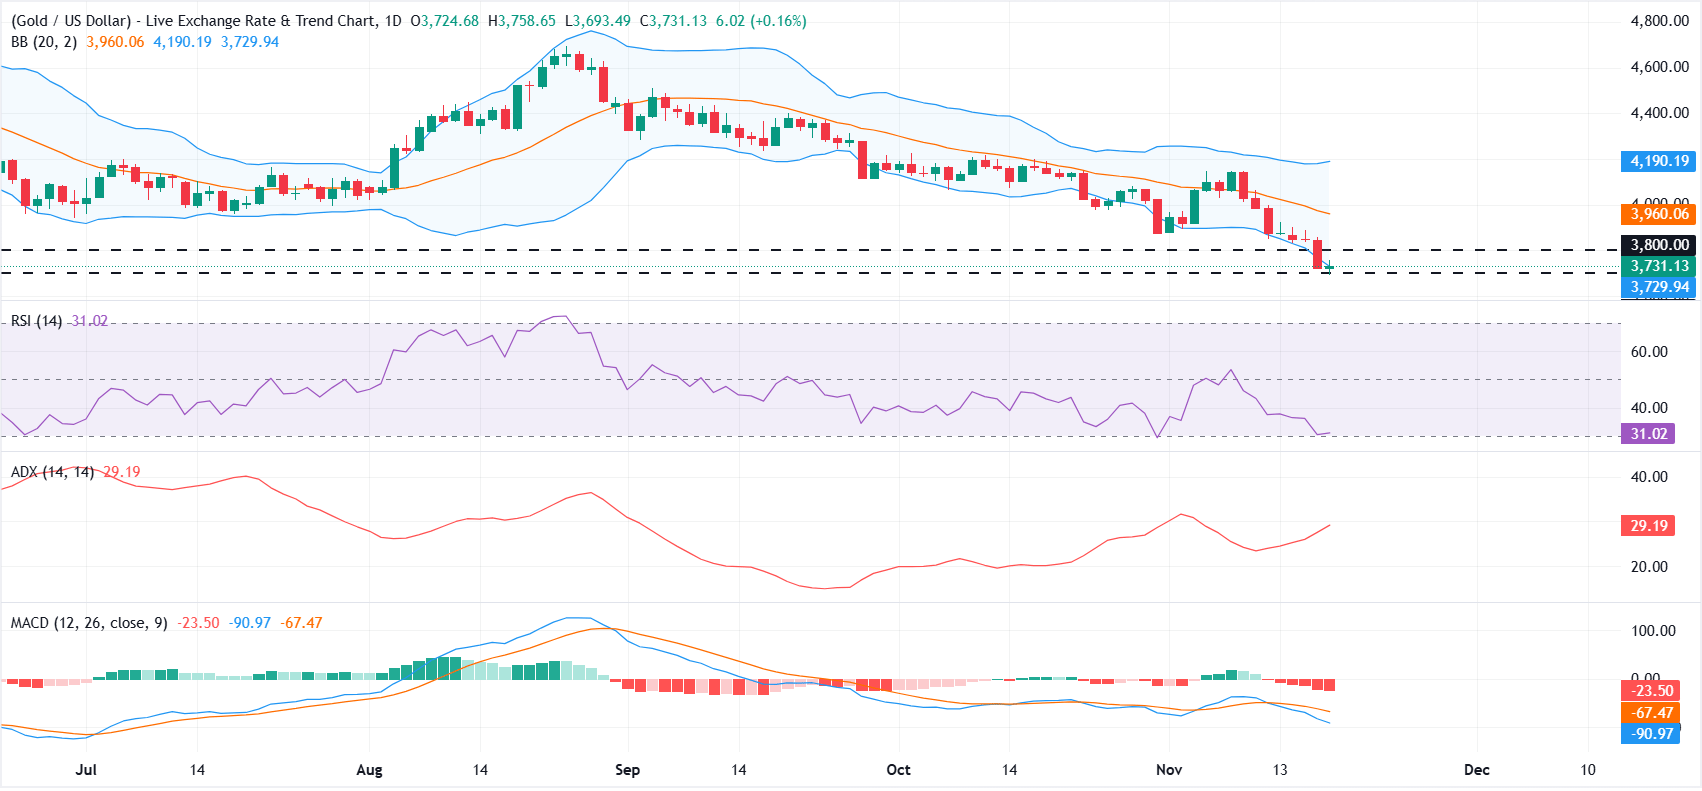
On the daily chart, XAU/USD is extending a bearish near-term tone as it holds below the Bollinger middle Simple Moving Average (SMA) at $3,960. Price is hovering just near the lower Bollinger band, highlighting downside pressure, while the Relative Strength Index (RSI) at 31 is flirting with oversold territory and the Average Directional Index (ADX) near 29 suggests a strengthening trend phase. The Moving Average Convergence Divergence (MACD) indicator remains firmly negative, reinforcing the notion that rallies are likely to be sold while price trades beneath the key volatility midline.
On the topside, initial resistance emerges at the horizontal barrier of $3,800, ahead of the Bollinger middle SMA at $3,960, with the upper band near $4,189 marking a more distant cap if a corrective bounce develops. On the downside, immediate support is seen at the lower Bollinger band around $3,731, followed by the horizontal floor at $3,700, where a clear break would open the door to an extension of the current bearish phase.
(The technical analysis of this story was written with the help of an AI tool. Know more.)
US Dollar Price Today
The table below shows the percentage change of US Dollar (USD) against listed major currencies today. US Dollar was the strongest against the Japanese Yen.
| USD | EUR | GBP | JPY | CAD | AUD | NZD | CHF | |
|---|---|---|---|---|---|---|---|---|
| USD | -0.28% | -0.16% | 0.38% | -0.15% | 0.05% | -0.66% | -0.14% | |
| EUR | 0.28% | 0.12% | 0.70% | 0.12% | 0.33% | -0.39% | 0.14% | |
| GBP | 0.16% | -0.12% | 0.57% | -0.00% | 0.21% | -0.50% | 0.01% | |
| JPY | -0.38% | -0.70% | -0.57% | -0.56% | -0.34% | -1.07% | -0.55% | |
| CAD | 0.15% | -0.12% | 0.00% | 0.56% | 0.21% | -0.51% | 0.02% | |
| AUD | -0.05% | -0.33% | -0.21% | 0.34% | -0.21% | -0.69% | -0.20% | |
| NZD | 0.66% | 0.39% | 0.50% | 1.07% | 0.51% | 0.69% | 0.55% | |
| CHF | 0.14% | -0.14% | -0.01% | 0.55% | -0.02% | 0.20% | -0.55% |
The heat map shows percentage changes of major currencies against each other. The base currency is picked from the left column, while the quote currency is picked from the top row. For example, if you pick the US Dollar from the left column and move along the horizontal line to the Japanese Yen, the percentage change displayed in the box will represent USD (base)/JPY (quote).