Gold struggles below $4,100 as US Nonfarm Payrolls takes centre stage



- Gold retreats as the US Dollar regains ground ahead of the US jobs report.
- A stronger US jobs report could lift the Dollar and deepen bullion’s losses.
- The AI-led equity sell-off leaves Gold exposed to liquidity-driven selling.
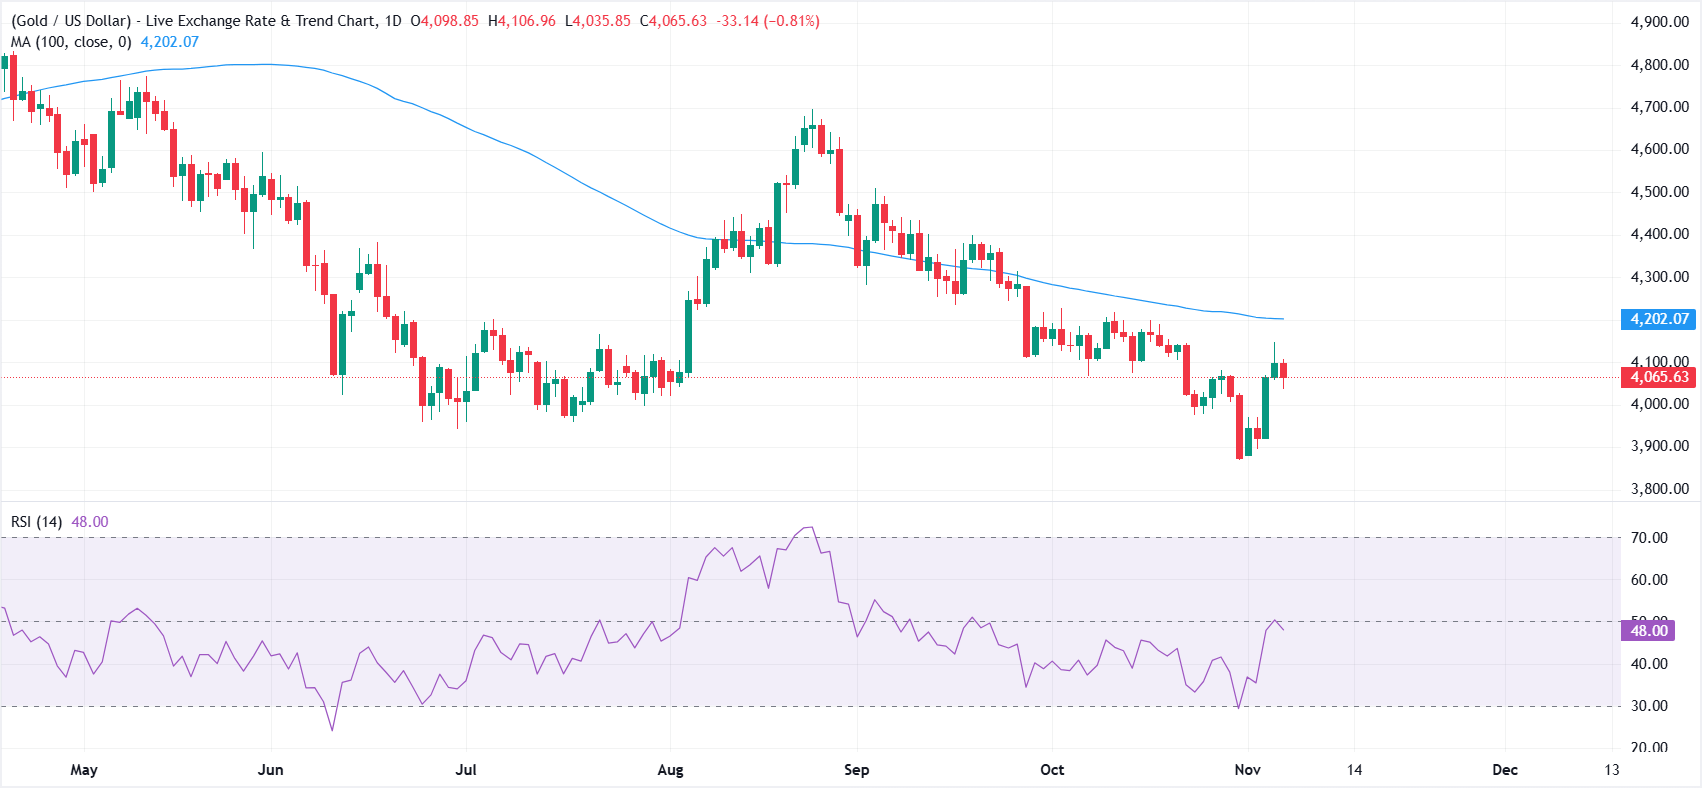
Gold (XAU/USD) struggles below $4,100 on Friday after climbing to a two-week high of $4,146 the previous day. A rebound in the US Dollar (USD) weighs on the metal, with attention turning to the US Nonfarm Payrolls report due at 13:30 GMT. At the time of writing, XAU/USD trades around $4,065, down 0.81% on the day, after reaching an intraday low of $4,035.
The US economy is expected to have added 65K jobs in October, up from 29K in September, while the Unemployment Rate is forecast to hold steady at 4.2%. Stronger-than-expected figures would point to a steady labour market, giving the Federal Reserve (Fed) more room to keep fighting inflation.
This could strengthen bets on a December interest rate hike, lifting the US Dollar and putting further pressure on Gold. Conversely, softer data could temper those expectations, weighing on the Greenback and helping bullion recover.
The US Dollar Index (DXY), which tracks the Greenback against a basket of six major currencies, trades around 102.00, up 0.40% on the day.
Meanwhile, the deepening AI-led sell-off in equities leaves Gold vulnerable to liquidity-driven selling as investors cut positions to raise cash, meet margin calls or cover losses elsewhere.
Still, bullion remains set to break a three-week losing streak, supported by a sharp drop in Oil prices. West Texas Intermediate (WTI) is down around 12% so far this week as the Democratic sweep of Congress in the US midterm elections fuels expectations that lawmakers could curb President Donald Trump’s military campaign against Iran.
However, a negotiated end to the US-Iran war still appears distant despite ongoing diplomatic efforts, while Oil prices have recovered some ground, limiting Gold’s upside. US President Donald Trump said the US may have to “destroy” the rest of Iran, adding that people will “know soon enough” whether he will act.
Crude and its impact on inflation and interest rates have been key drivers for bullion since the war began in late February. Higher energy costs have added to pressure on central banks to tighten monetary policy, weighing on the non-yielding metal.
US Dollar Price Today
The table below shows the percentage change of US Dollar (USD) against listed major currencies today. US Dollar was the strongest against the New Zealand Dollar.
| USD | EUR | GBP | JPY | CAD | AUD | NZD | CHF | |
|---|---|---|---|---|---|---|---|---|
| USD | 0.39% | 0.41% | 0.28% | 0.38% | 0.85% | 0.93% | 0.11% | |
| EUR | -0.39% | 0.02% | -0.09% | -0.00% | 0.46% | 0.53% | -0.29% | |
| GBP | -0.41% | -0.02% | -0.11% | -0.02% | 0.45% | 0.51% | -0.31% | |
| JPY | -0.28% | 0.09% | 0.11% | 0.11% | 0.57% | 0.64% | -0.18% | |
| CAD | -0.38% | 0.00% | 0.02% | -0.11% | 0.46% | 0.53% | -0.28% | |
| AUD | -0.85% | -0.46% | -0.45% | -0.57% | -0.46% | 0.07% | -0.74% | |
| NZD | -0.93% | -0.53% | -0.51% | -0.64% | -0.53% | -0.07% | -0.80% | |
| CHF | -0.11% | 0.29% | 0.31% | 0.18% | 0.28% | 0.74% | 0.80% |
The heat map shows percentage changes of major currencies against each other. The base currency is picked from the left column, while the quote currency is picked from the top row. For example, if you pick the US Dollar from the left column and move along the horizontal line to the Japanese Yen, the percentage change displayed in the box will represent USD (base)/JPY (quote).