Silver Price Forecast: Lower highs keep XAG/USD under pressure despite recent rebound



- Silver loses momentum following Wednesday's sharp rally as the US Dollar and Treasury yields recover.
- XAG/USD remains below the Bollinger midline near $55, keeping the broader bearish bias intact.
- RSI recovers from oversold territory, but negative MACD and elevated ADX signal persistent selling pressure.
Silver (XAG/USD) struggles to extend gains on Thursday after surging 5.18% the previous day, as a rebound in the US Dollar (USD) and Treasury yields takes some momentum out of the rally. The white metal climbed to $53.48 earlier on Thursday, its highest level since October 29, before easing to around $52.79 at the time of writing.
Wednesday’s rally followed the Democratic sweep of Congress, with traders betting that a divided government could curb fiscal expansion and put pressure on President Donald Trump to end the war with Iran. The outcome triggered broad-based US Dollar weakness, while tumbling Oil prices eased inflation concerns and helped push Treasury yields lower, lifting demand for precious metals.
However, expectations of another interest rate hike by the Federal Reserve (Fed) in December provide support for the Greenback and remain a headwind for non-yielding assets such as Silver.
Data released on Thursday showed US Initial Jobless Claims fell to 189K from 194K, below expectations of 196K. The four-week moving average declined to 194.75K from 196.75K. Attention now shifts to Friday’s US Nonfarm Payrolls (NFP) report for fresh clues on the Fed’s policy path.
Technical Analysis
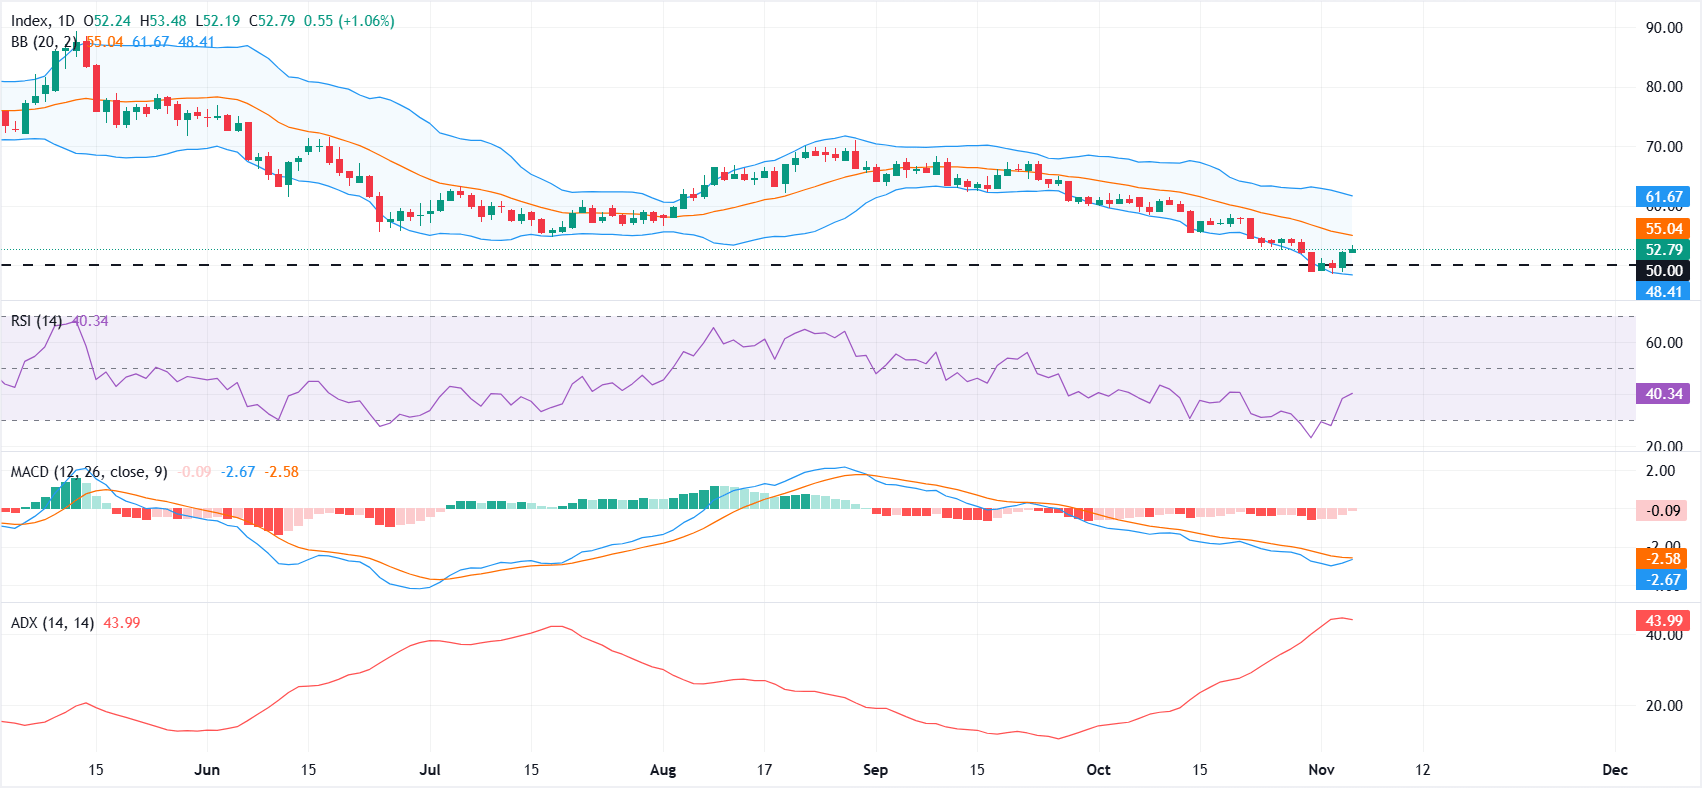
On the daily chart, XAG/USD continues to form lower highs after briefly peaking near $70 in late August, signalling that sellers retain control. The metal holds below the Bollinger Bands’ 20-period Simple Moving Average (SMA) at roughly $55 and well under the upper band resistance near $61.67. Price is sliding within the lower half of the volatility envelope.
The Relative Strength Index (RSI) (14) has recovered from oversold territory to around 40 but remains below the midline and Moving Average Convergence Divergence (MACD) remains slightly negative, hinting that downside momentum persists despite a modest loss of selling pressure, with a strong Average Directional Index (ADX) above 40 underscoring a still-solid prevailing trend.
On the downside, immediate support is seen at the horizontal floor around $50.00, ahead of the lower Bollinger Band near $48.40, where volatility support could emerge if the selloff extends. On the topside, initial resistance comes at the Bollinger mid-line at about $55.04, and only a sustained recovery above that barrier would open the way toward the upper band resistance around $61.67, where sellers are likely to reassert control.
(The technical analysis of this story was written with the help of an AI tool. Know more.)