


Dogecoin Price Forecast: Extended correction and weakening momentum raise downside risks



- Dogecoin extends its correction, falling more than 5% and trading around $0.090 mid-week.
- Rising short positions and signs of overheated conditions among traders increase the risk of further downside in DOGE.
- The technical outlook shows weakening momentum, hinting at a deeper correction.
Dogecoin (DOGE) extends its losses, trading around $0.090 on Wednesday, down more than 5% so far this week. Bearish pressure is strengthening, with short positions reaching a one-month high and traders in overheated conditions. Meanwhile, weakening momentum indicators are also hinting at further losses in DOGE.
Dogecoin key metrics show bearish signs
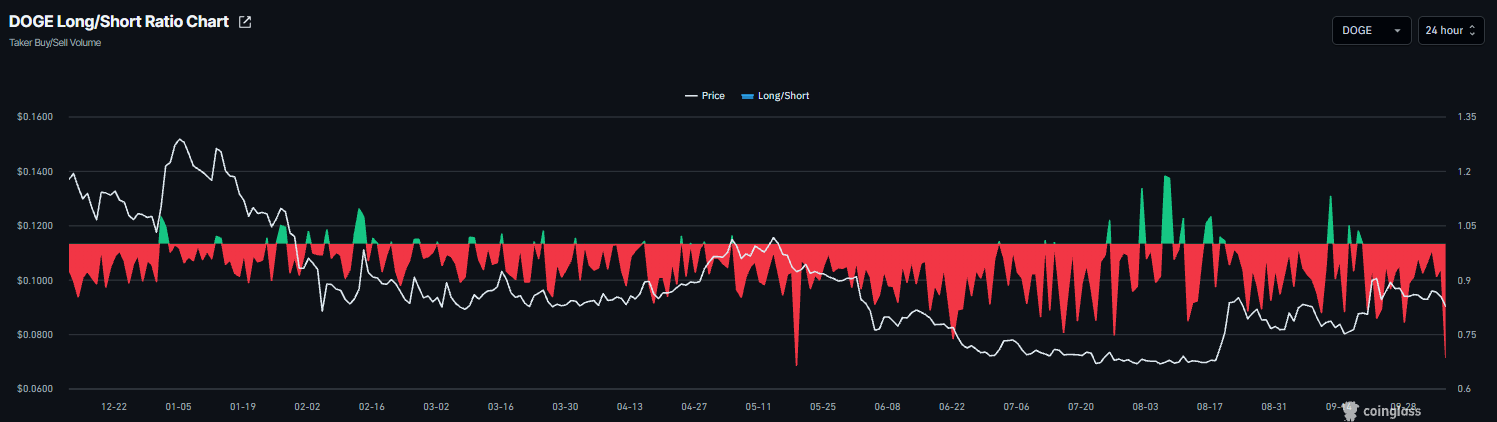
Derivatives data shows cautious signals among traders. CoinGlass’ long-to-short ratio for Dogecoin reads 0.68 on Wednesday, the lowest level over a month. A ratio being below one indicates bearish sentiment, as traders bet that asset prices will fall.
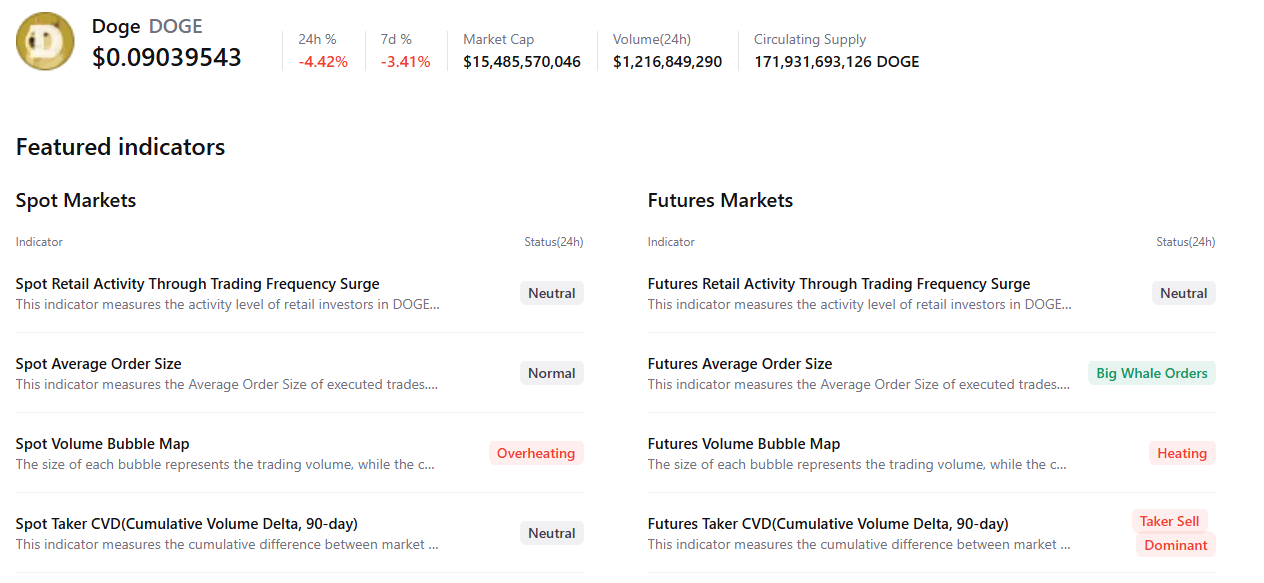
CryptoQuant’s summary data also shows a bearish outlook for the dog-themed meme coin. DOGE’s spot and futures markets show overheating conditions, while the futures market shows large whale orders but with sell-side dominance. These highlight a bearish, cautious sentiment bias among Dogecoin traders.
Dogecoin technical outlook: DOGE slips below key 200-day EMA
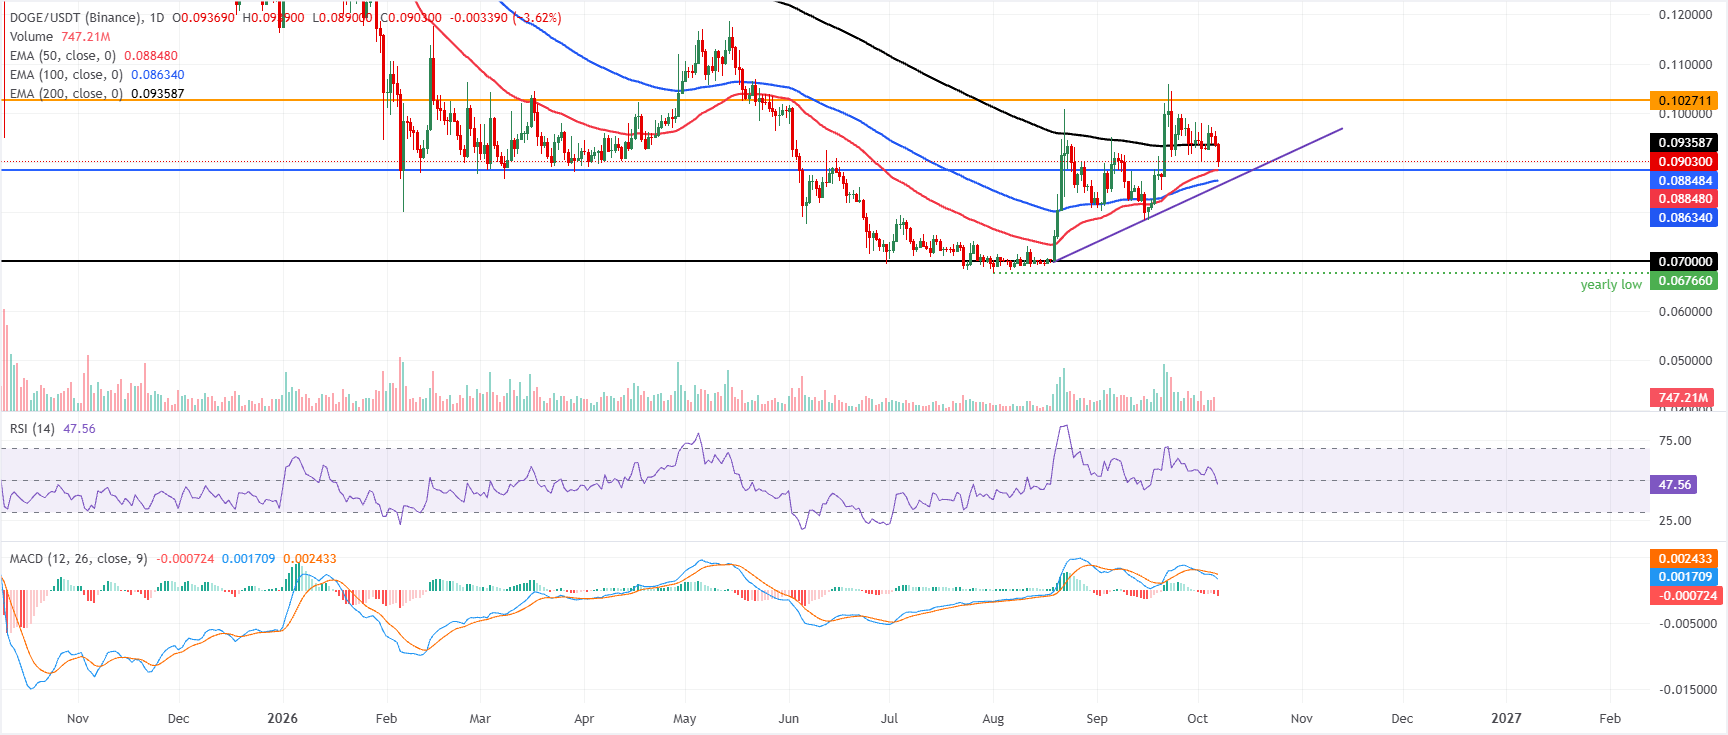
Dogecoin price trades at $0.090 on Wednesday, down over 5% so far this week. Despite the correction, DOGE remains mildly bearish in the near term, capped below the 200-day Exponential Moving Average (EMA) at $0.093. Price holds above the 50-day EMA at $0.088 and the 100-day EMA at $0.086, suggesting underlying demand still supports the broader uptrend structure, but the Relative Strength Index (RSI) near 48 and a slightly negative Moving Average Convergence Divergence (MACD) line hint at fading momentum while the pair consolidates under the recent highs.
On the downside, immediate support clusters around $0.088, where the 50-day EMA coincides with a horizontal level, followed by the 100-day EMA at $0.086 and the former trendline break area near $0.085; a daily close below this zone would open the way to the deeper horizontal floor at $0.070.
On the topside, DOGE would need to reclaim the 200-day EMA at $0.093 to ease bearish pressure, with the next notable resistance coming at the horizontal barrier around $0.102, where sellers are likely to re-emerge.
(The technical analysis of this story was written with the help of an AI tool. Know more.)
Recommended Articles










Comments (0)
Click the $ button, enter the symbol, and select to link a stock, ETF, or other ticker.