


Ripple Price Forecast: XRP rebounds as whale inflows rise



- XRP recovers above $1.40 after three consecutive days of declines.
- Whale accumulation rises to 460 million XRP, the highest since February.
- XRP structural outlook remains bullish, but momentum indicators suggest overheating.
Ripple (XRP) holds above $1.40 support on Wednesday, as bulls return to take control following three consecutive days of declines. The remittance token’s upside appears capped at $1.50 while extended gains would face additional resistance at $1.70. A break above $2.00 would mark a potential regime shift from bearish to bullish.
XRP whales increase accumulation
XRP rallied by 72% last week, hitting highs around $1.70 before a correction to test support at $1.40 earlier this week. The rally was fueled by increased liquidity as the United States (US) Treasury launched long-term bond buybacks and higher demand through spot Exchange-Traded Funds (ETFs) and derivatives.
This reinforced expectations of easier financial conditions and revived demand for risk assets. Whale inflows surged to approximately 460 million XRP, the highest since February.
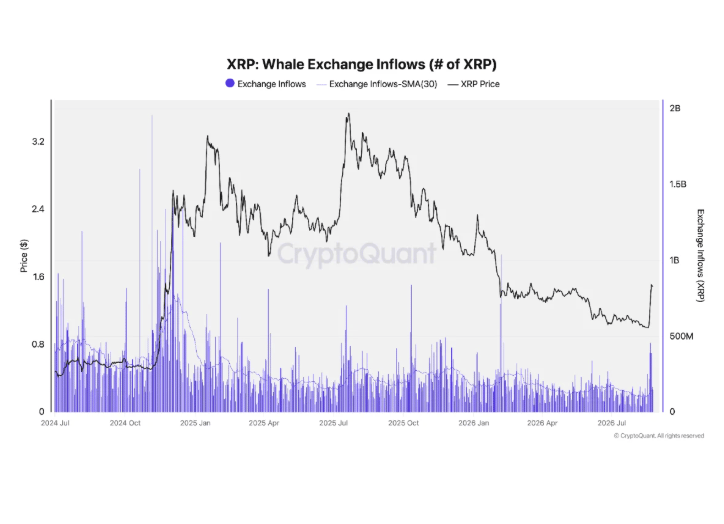
XRP spot ETFs continue to gain momentum, with inflows surging to $28 million on Wednesday, up from $24 million the previous day. This pushed cumulative inflows to $1.62 billion. Meanwhile, total assets under management average $1.40 billion.
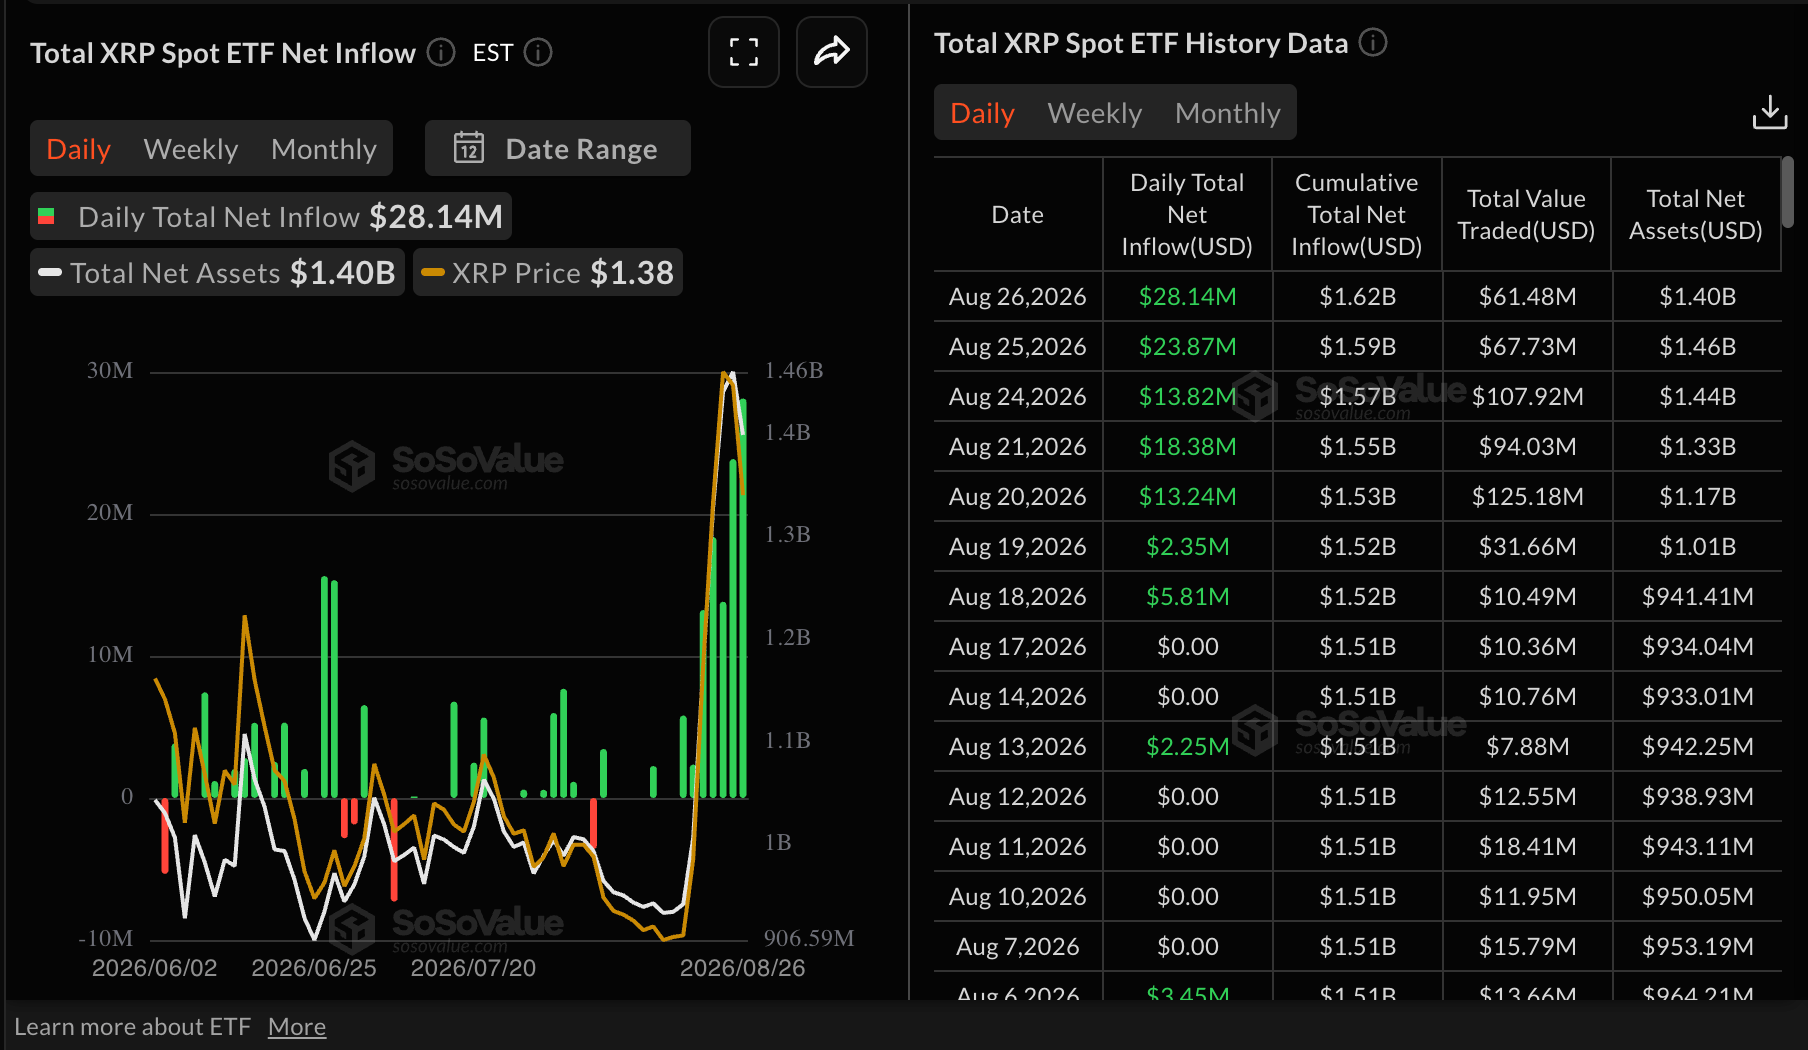
However, the correction over the last three days was driven mainly by profit-taking and significantly overheated market conditions.
Technical analysis: XRP retains bullish momentum
XRP trades around $1.44, extending its break above the key Exponential Moving Averages (EMAs) and reinforcing a bullish near-term bias. The spot price holds well above the 50-day EMA at $1.17, the 100-day EMA at $1.20 and the 200-day EMA at $1.35, suggesting a solid underlying demand zone after reclaiming the prior trendline break area around $1.00.
Momentum is constructive, with the Relative Strength Index (RSI) hovering in bullish territory near 73 and the Moving Average Convergence Divergence (MACD) remaining positive, hinting that buyers still control the tape despite stretched short-term conditions.
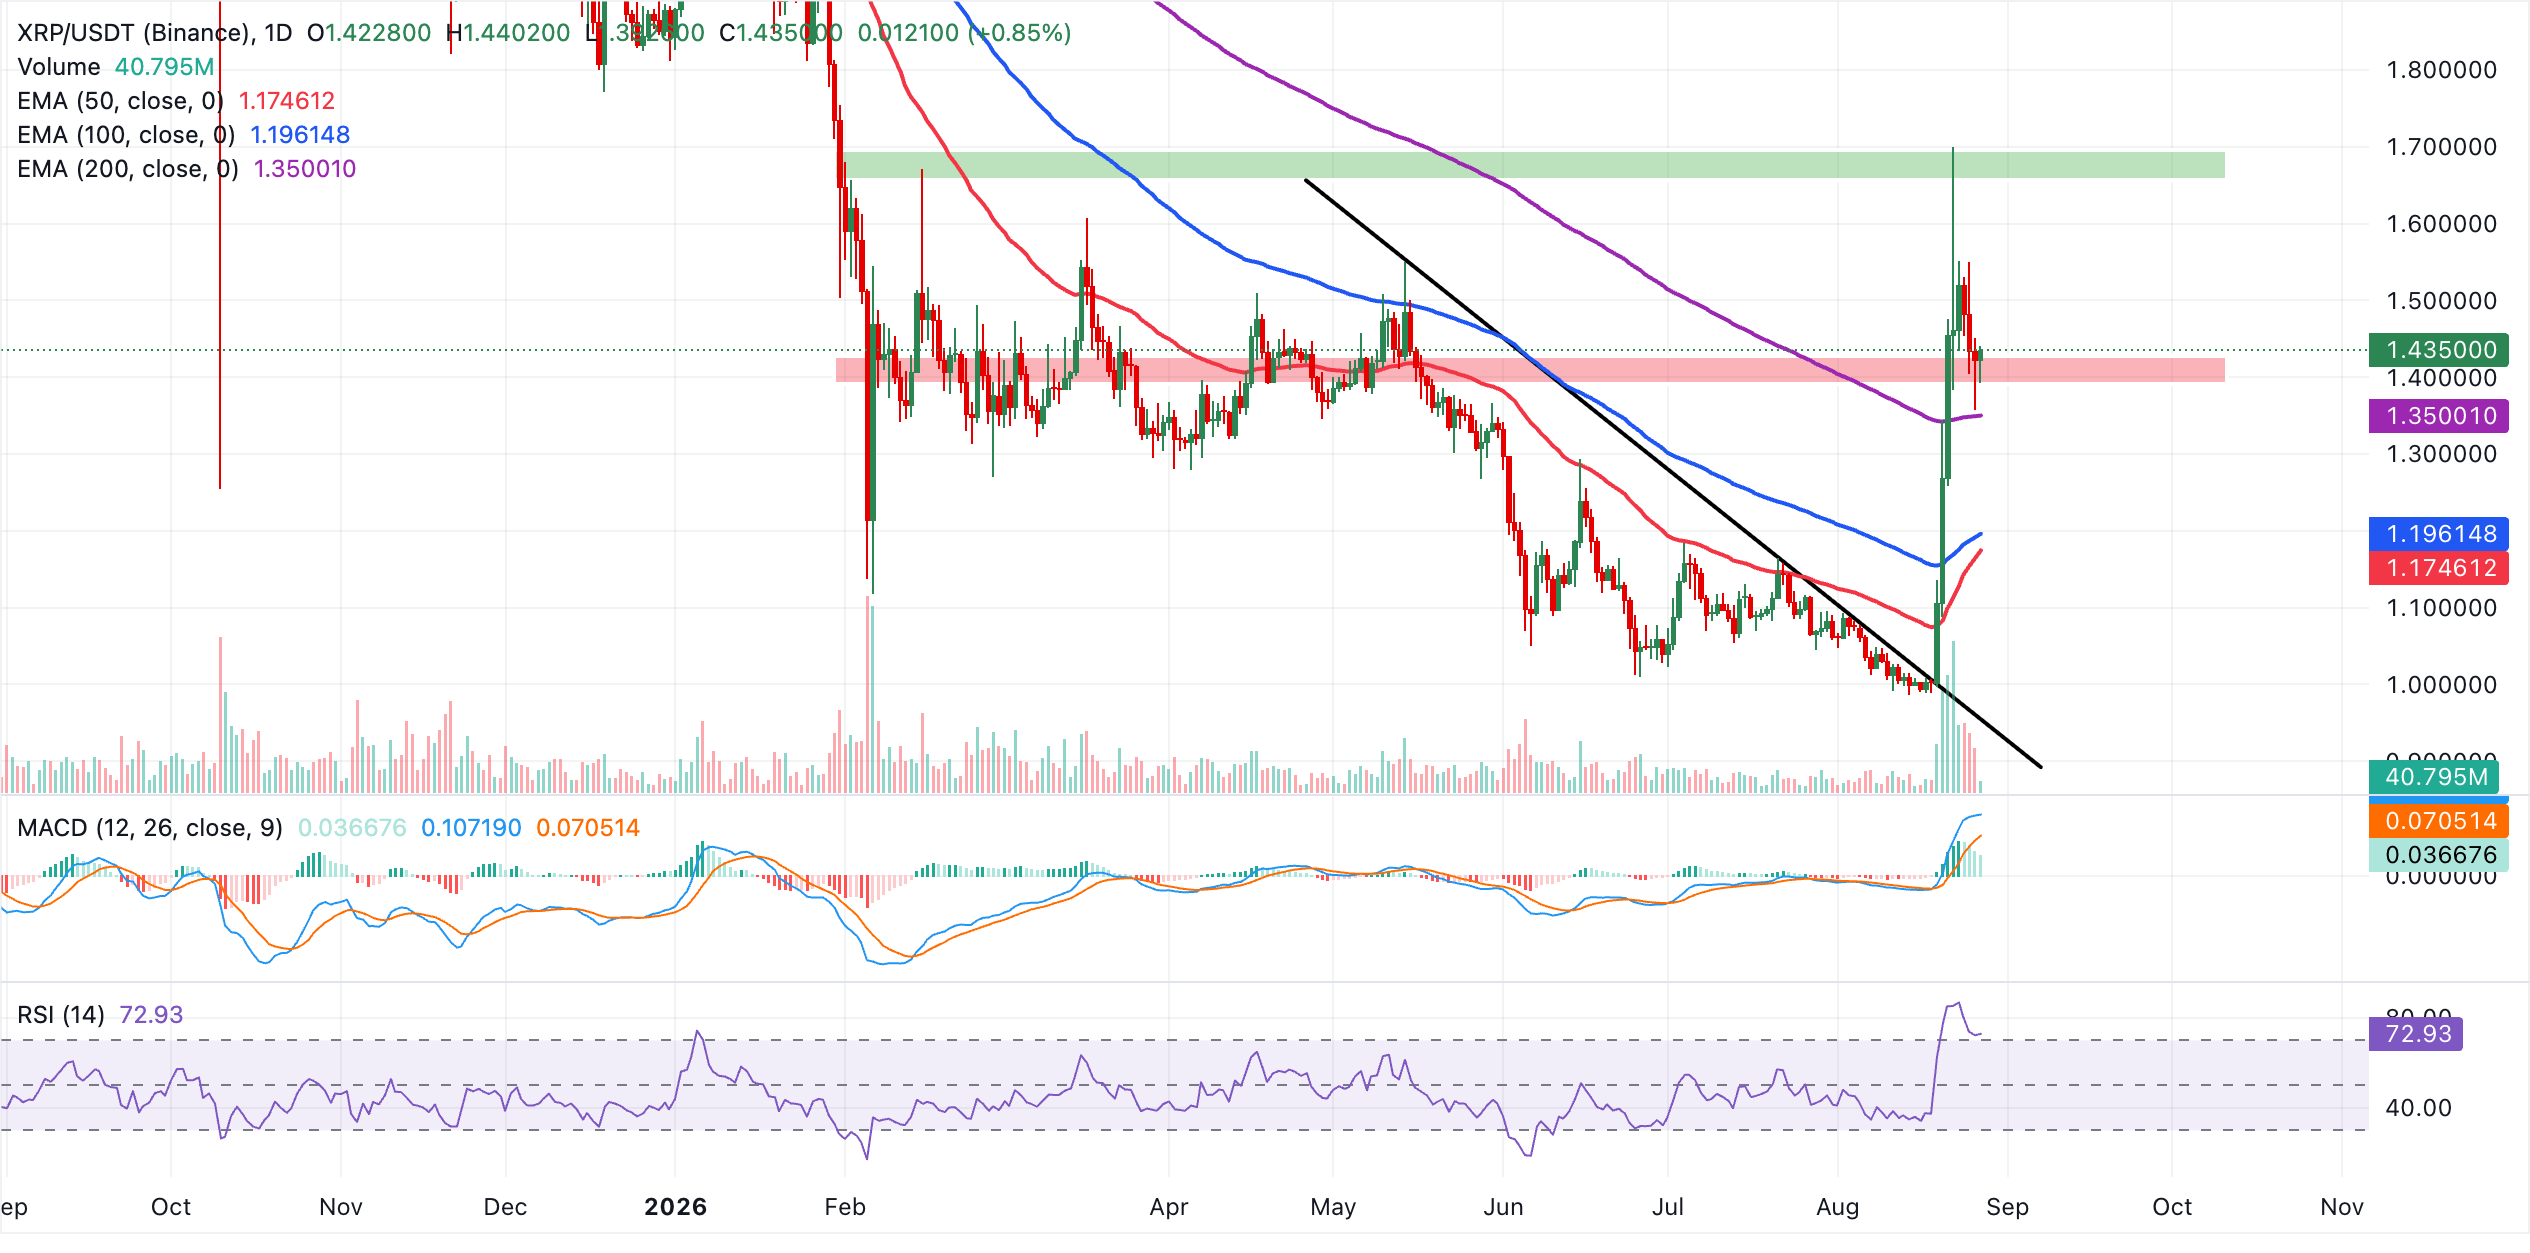
Initial support emerges at the current price area around $1.44, ahead of a deeper layer formed by the 200-day EMA at $1.35 and the cluster of shorter EMAs near $1.20-$1.17, followed by the former break zone close to $1.00. On the topside, the next meaningful hurdle is the descending resistance trendline drawn from $1.66, which remains the first structural cap. A daily close above that barrier would open the way for further gains, while failure to clear it would likely trigger consolidation or a corrective pullback toward the highlighted support band.
(The technical analysis of this story was written with the help of an AI tool. Know more.)
Cryptocurrency metrics FAQs
The developer or creator of each cryptocurrency decides on the total number of tokens that can be minted or issued. Only a certain number of these assets can be minted by mining, staking or other mechanisms. This is defined by the algorithm of the underlying blockchain technology. On the other hand, circulating supply can also be decreased via actions such as burning tokens, or mistakenly sending assets to addresses of other incompatible blockchains.
Market capitalization is the result of multiplying the circulating supply of a certain asset by the asset’s current market value.
Trading volume refers to the total number of tokens for a specific asset that has been transacted or exchanged between buyers and sellers within set trading hours, for example, 24 hours. It is used to gauge market sentiment, this metric combines all volumes on centralized exchanges and decentralized exchanges. Increasing trading volume often denotes the demand for a certain asset as more people are buying and selling the cryptocurrency.
Funding rates are a concept designed to encourage traders to take positions and ensure perpetual contract prices match spot markets. It defines a mechanism by exchanges to ensure that future prices and index prices periodic payments regularly converge. When the funding rate is positive, the price of the perpetual contract is higher than the mark price. This means traders who are bullish and have opened long positions pay traders who are in short positions. On the other hand, a negative funding rate means perpetual prices are below the mark price, and hence traders with short positions pay traders who have opened long positions.
Recommended Articles









Comments (0)
Click the $ button, enter the symbol, and select to link a stock, ETF, or other ticker.