


Ripple Price Forecast: XRP remains range-bound above key support



- XRP trades sideways above $1.00, with upside remaining capped.
- Retail demand steadies, with futures Open Interest climbing to 2.41 billion XRP.
- A persistent MACD sell signal and declining moving averages point to a weak XRP technical structure.
Ripple (XRP) holds firmly above the $1.00 near-term support at the time of writing on Monday. The remittance token’s upside is capped under key descending moving averages, undermining the broader technical outlook.
XRP attracts modest capital inflows
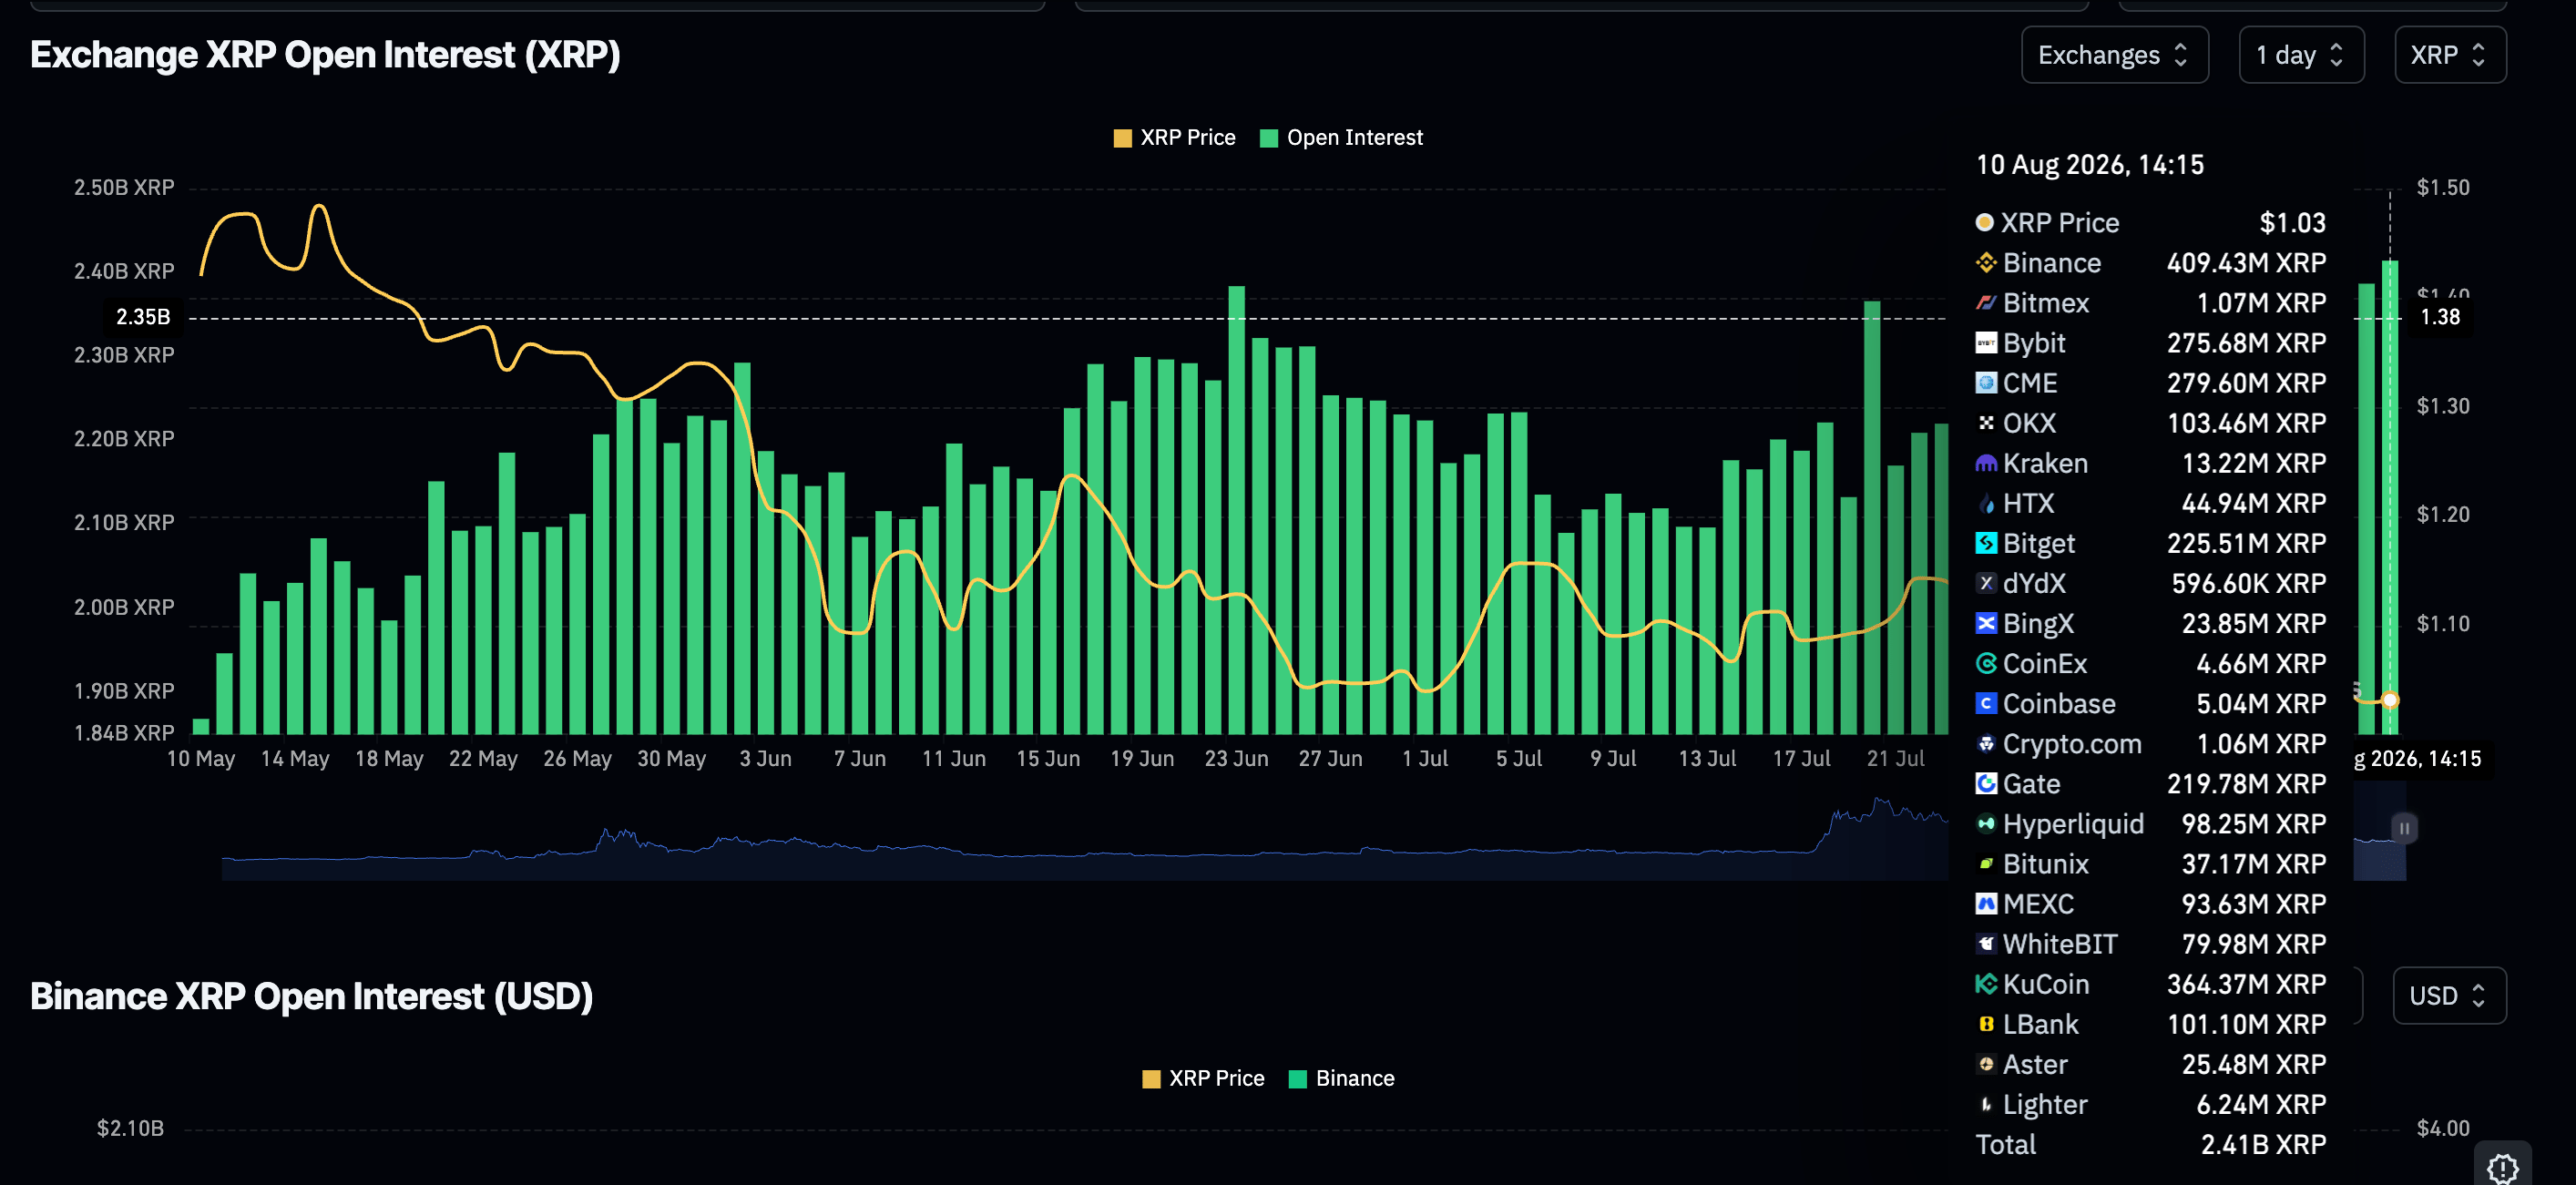
Retail interest in derivatives continues to gain momentum, as perpetual futures Open Interest (OI) climbs to an average of 2.41 billion XRP on Monday from 2.39 billion XRP the previous day.
Broadening the view, OI was at 2.12 billion XRP on August 5, a 12% rise. If this momentum in retail participation persists, XRP could defend the key $1.00 support, raising the probability of a sustained recovery.
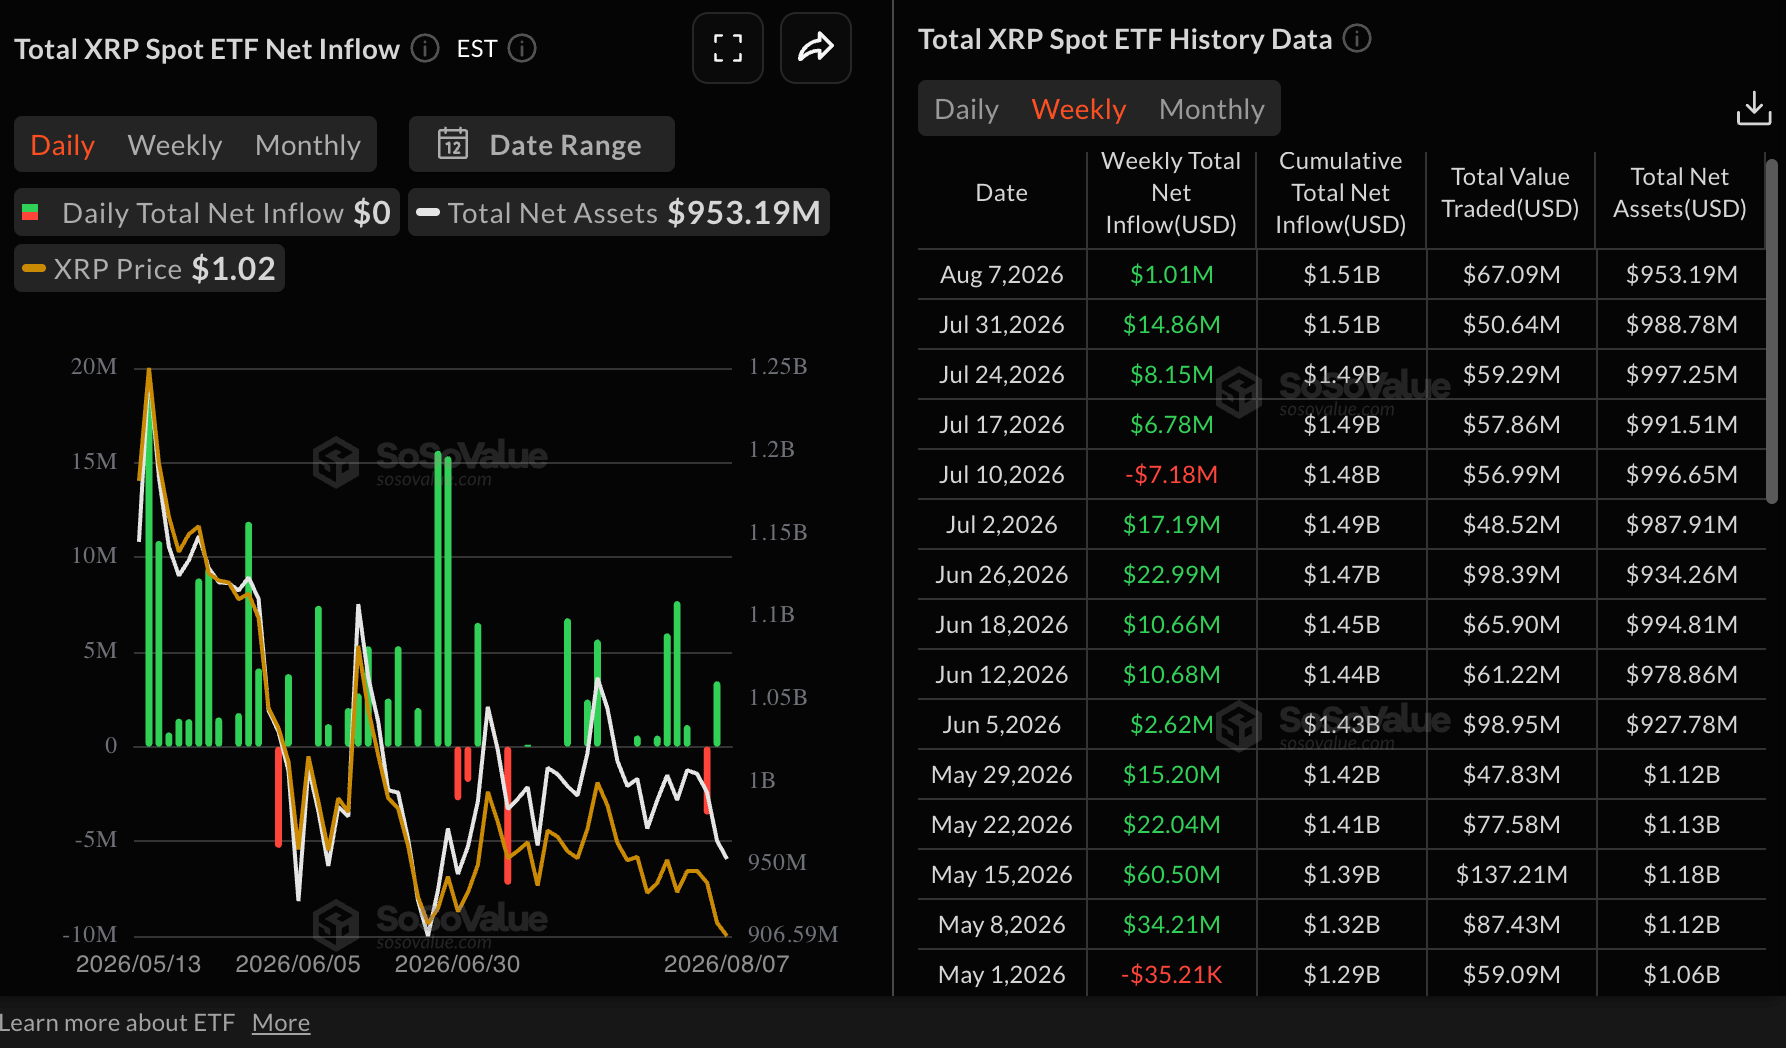
US-listed XRP spot Exchange-Traded Funds (ETFs) attracted $1.01 million in inflows last week, further reinforcing the bullish momentum observed in recent weeks. Total cumulative inflows have reached $1.51 billion, while assets under management now stand at $953 million.
Technical analysis: XRP remains pressed toward $1.00 support
XRP trades at $1.03, extending a bearish near-term bias as price holds beneath the cluster of Exponential Moving Averages (EMAs) and the prevailing downward resistance trendline. The 50-day EMA at $1.10, the 100-day EMA at $1.18 and the 200-day EMA at $1.37 all sit above spot, suggesting the broader trend remains under pressure, while the downward resistance line, now projected around $1.05, continues to cap recovery attempts.
Momentum indicators reinforce this weak tone, with the Relative Strength Index (RSI) hovering near 40 and the Moving Average Convergence Divergence (MACD) in negative territory, hinting that rallies are still likely to be sold.
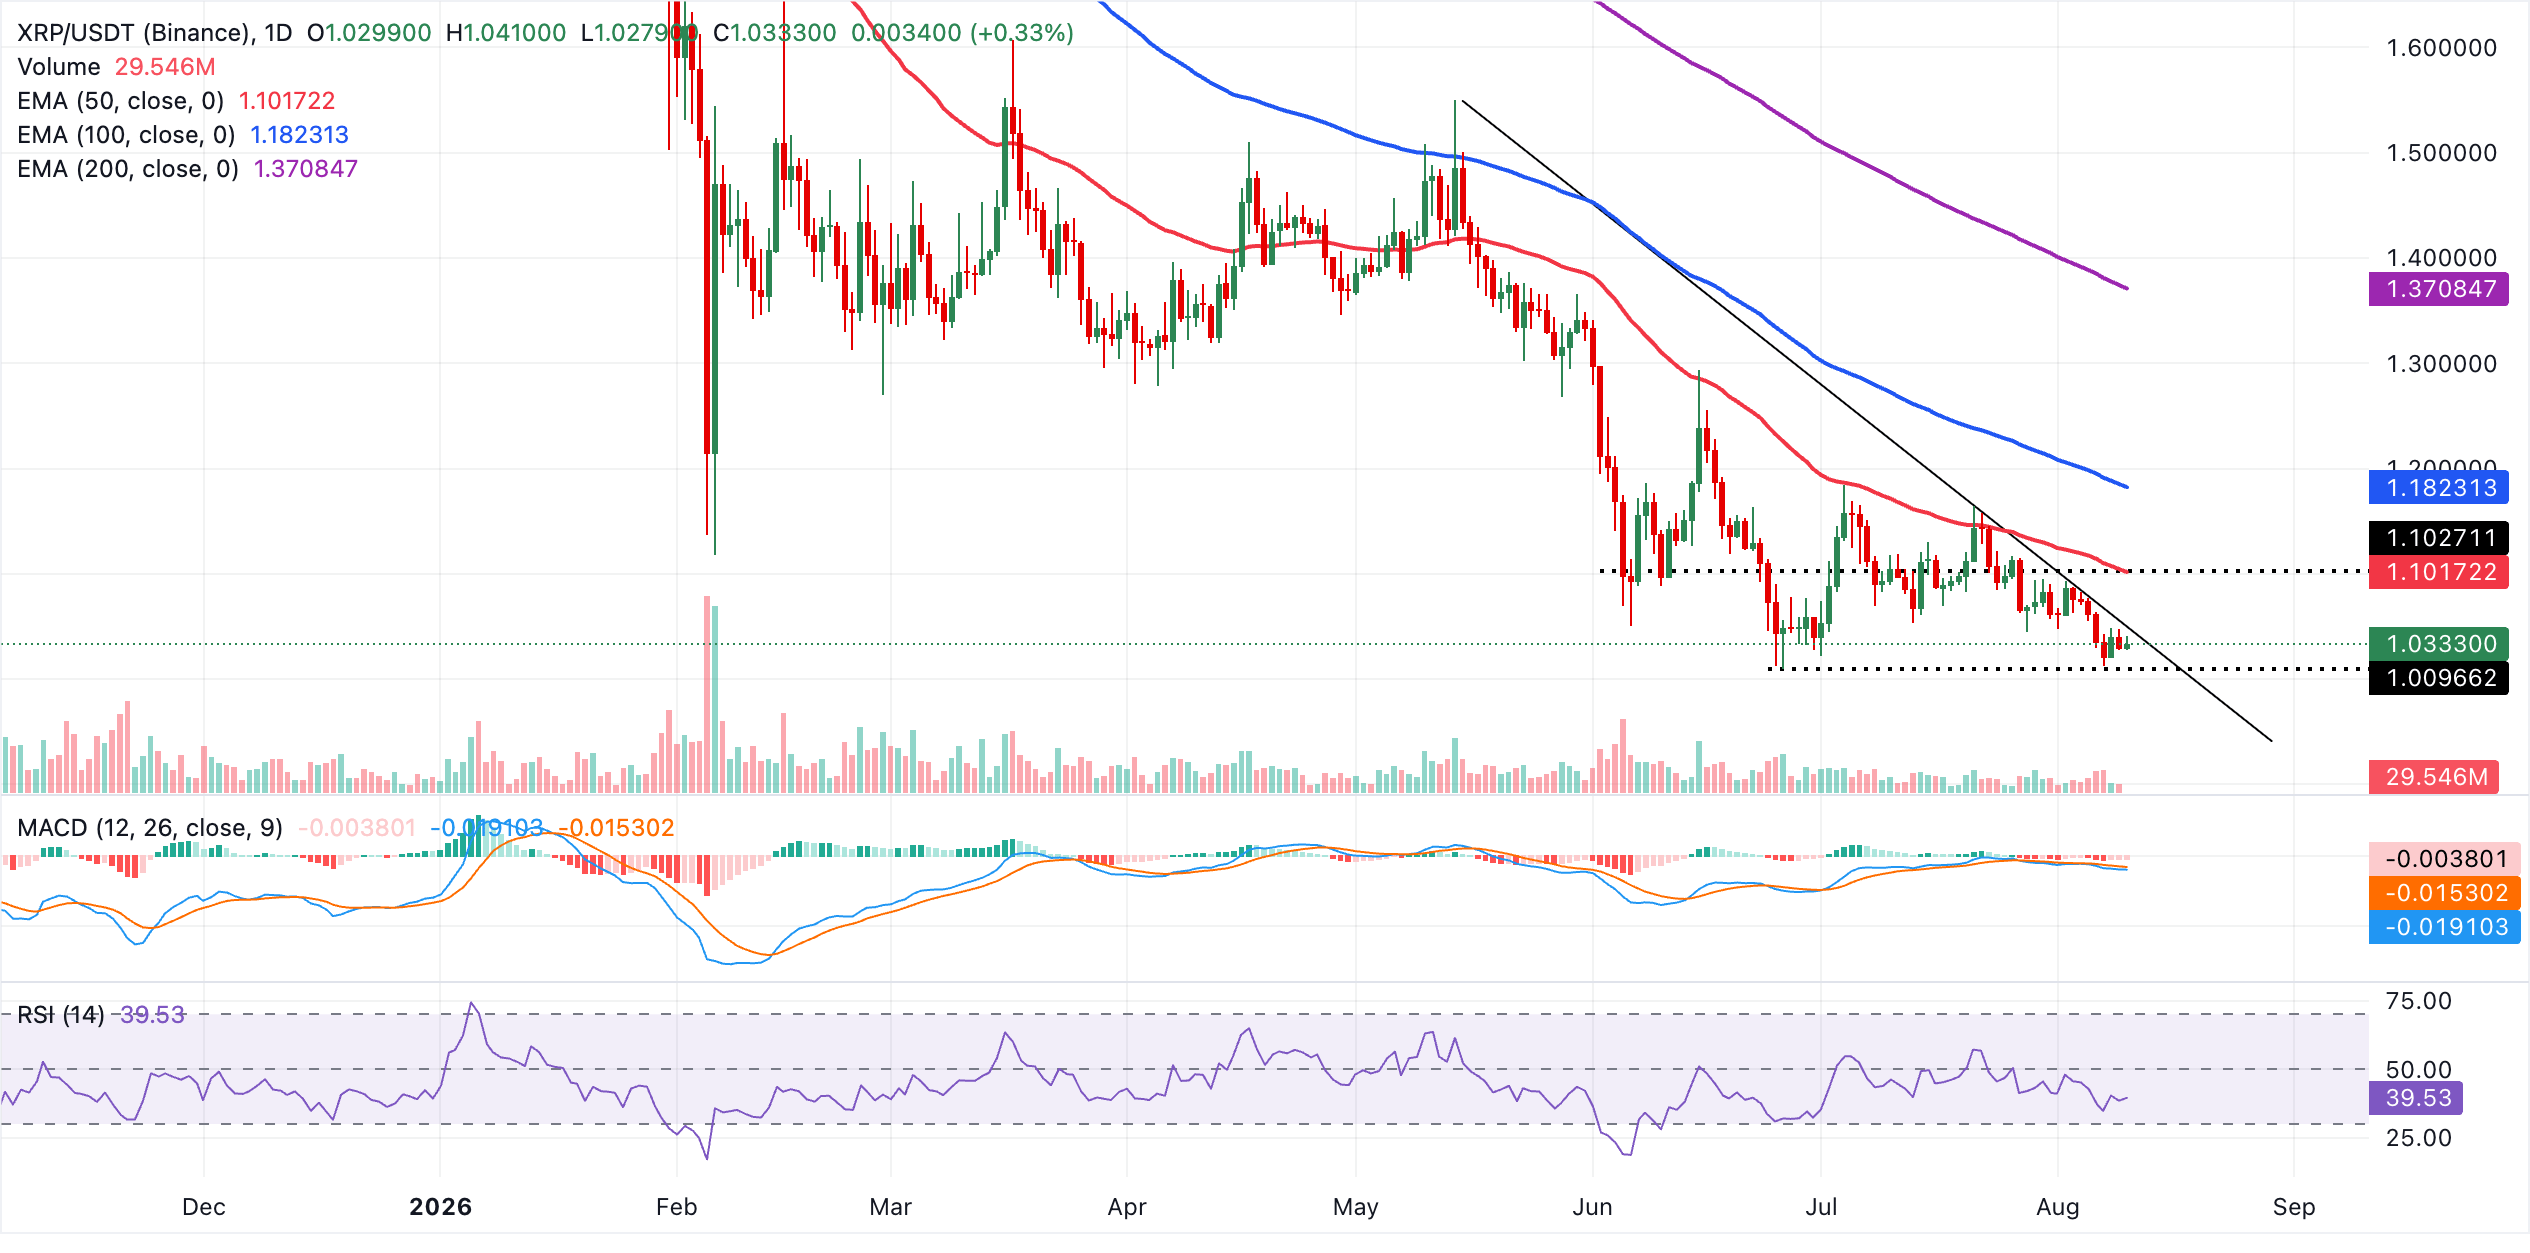
On the topside, initial resistance lies at the downward resistance trend line near $1.05, where any bounce would first be challenged. A break above this barrier would expose the 50-day EMA around $1.10, followed by the 100-day EMA at $1.18, while the 200-day EMA near $1.37 stands as a more distant cap within the broader downtrend. The pair remains vulnerable to further downside as long as it trades below these stacked resistances.
(The technical analysis of this story was written with the help of an AI tool. Know more.)
Open Interest, funding rate FAQs
Higher Open Interest is associated with higher liquidity and new capital inflow to the market. This is considered the equivalent of increase in efficiency and the ongoing trend continues. When Open Interest decreases, it is considered a sign of liquidation in the market, investors are leaving and the overall demand for an asset is on a decline, fueling a bearish sentiment among investors.
Funding fees bridge the difference between spot prices and prices of futures contracts of an asset by increasing liquidation risks faced by traders. A consistently high and positive funding rate implies there is a bullish sentiment among market participants and there is an expectation of a price hike. A consistently negative funding rate for an asset implies a bearish sentiment, indicating that traders expect the cryptocurrency’s price to fall and a bearish trend reversal is likely to occur.
Recommended Articles









Comments (0)
Click the $ button, enter the symbol, and select to link a stock, ETF, or other ticker.