


Solana Price Forecast: SOL consolidation near resistance as ETF inflows offer mild support



- Solana price faces rejection around the upper boundary of a consolidation range on Wednesday.
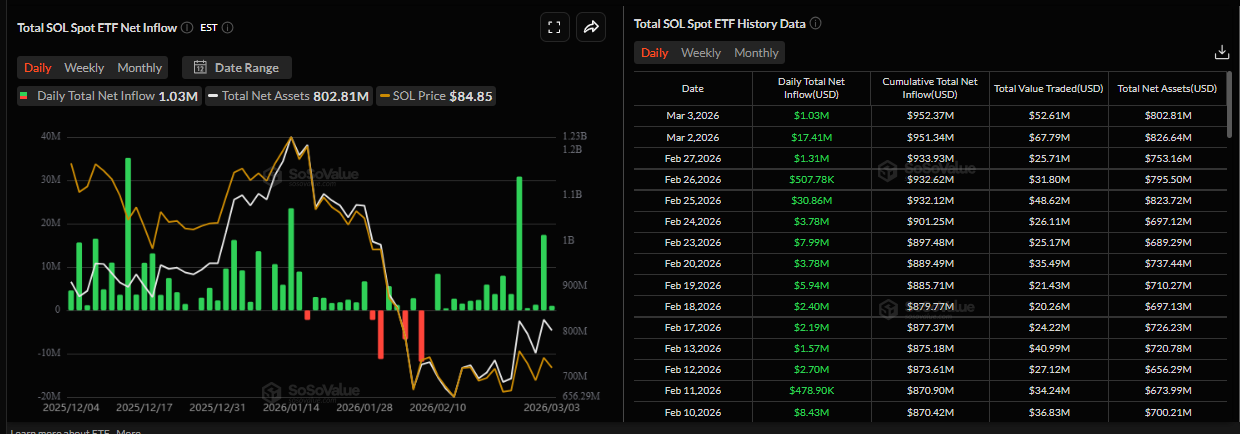
- US-listed spot SOL ETF recorded an inflow of $1.03 million on Tuesday after a $17.41 million positive flow the previous day.
- The technical outlook suggests a rally above $98 if SOL closes above the consolidation range.
Solana (SOL) price is facing slight rejection as it approaches the upper boundary of the consolidation range at around $88 on Wednesday. Institutional demand is strengthening as spot Exchange Traded Funds (ETFs) recorded two consecutive inflows so far this week. On the technical side, a decisive close above the consolidation range could trigger an upside move in SOL.
Institutional demand strengthens
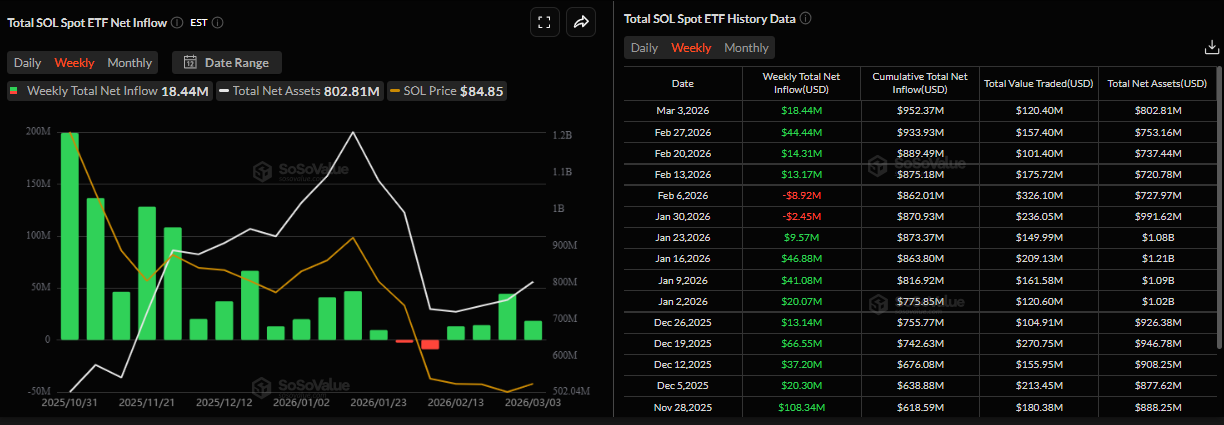
Institutional demand for Solana remains robust so far this week. SoSoValue data shows that spot SOL ETFs recorded an inflow of $1.03 million on Tuesday, following a $17.41 million inflow the previous day, a total of $18.44 million so far this week.
In addition, the inflow trend continues, with $44.44 million recorded in the previous week, the highest weekly flow since mid-January, signaling growing institutional interest. If this trend continues and intensifies, SOL could see an upward move in the upcoming weeks.
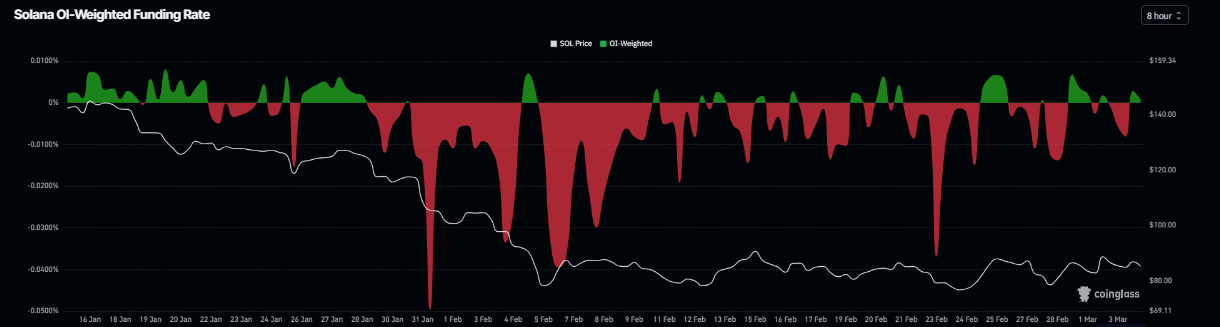
On the derivatives side, CoinGlass funding rates data also shows a positive outlook for Solana. The metric flipped to a positive rate on Wednesday, reading 0.0008%, indicating longs are paying shorts and suggesting bullish sentiment toward SOL.
Solana Price Forecast: SOL nears key resistance zone
Solana price is trading slightly down at $85.41 as of writing on Wednesday. The near-term bias is mildly bearish as price holds below the parallel channel upper boundary at $87.96 and remains capped by the broader descending resistance line from $253.51.
Daily closes remain well below the 50- and 100-day Exponential Moving Averages, clustered above $98.00, keeping the broader trend under pressure despite the recent bounce off the lower channel boundary near $77.60.
Momentum has improved from oversold extremes, with the Relative Strength Index (RSI) on the daily chart recovering toward the mid-40s, while the Moving Average Convergence Divergence (MACD) indicator remains in positive territory, suggesting fading downside momentum within an overarching downtrend.
Initial resistance aligns at the 23.6% Fibonacci retracement at $86.60, measured from the $67.50 low to the $148.44 high, with a break higher exposing the 38.2% retracement at $98.42 near the 50-day EMA as a stronger supply zone.
The upper boundary of the channel around $87.96 reinforces nearby resistance, and only a sustained move above the $103.56 trendline break area would soften the medium-term bearish structure.
On the downside, immediate support sits at the channel floor near $77.60, followed by the prior swing low and Fibonacci anchor at $67.50, where buyers would need to step in to prevent an extension of the prevailing decline.
(The technical analysis of this story was written with the help of an AI tool.)
Recommended Articles












Comments (0)
Click the $ button, enter the symbol, and select to link a stock, ETF, or other ticker.