

Dogecoin Price Forecast: Whale accumulate as bearish momentum fades

- Dogecoin price faces resistance at the lower boundary of a broken trendline.
- Santiment data shows that certain whales have accumulated DOGE at recent dips, suggesting easing selling pressure.
- The technical indicators suggest a short-term recovery, as bearish momentum is fading.
Dogecoin (DOGE) price trades in red, hovering near $0.095 at the time of writing on Monday, after falling over 7% in the previous week. On-chain data shows that certain whales have accumulated DOGE at recent dips, suggesting easing selling pressure and signaling short-term price stabilization. The technical outlook shows fading weakness in the momentum indicators, suggesting a potential recovery if DOGE climbs back above a lower trendline resistance.
Dogecoin whales buy 250 million tokens
Santiment’s Supply Distribution data supports a bullish outlook for Dogecoin, as certain whales are buying the dog-themed meme coin at recent price dips.
The metric indicates that whales holding between 100,000 and 1 million (red line) and 10 million and 100 million (blue line) DOGE tokens have accumulated a total of 250 million DOGE tokens since Thursday. During the same period, whales holding 1 million and 10 million (yellow line) have shed 110 million tokens. This shows that the first set of whales seized the opportunity and accumulated Dogecoin at a discount.
 [11-1770621901497-1770621901499.16.48, 09 Feb, 2026].png)
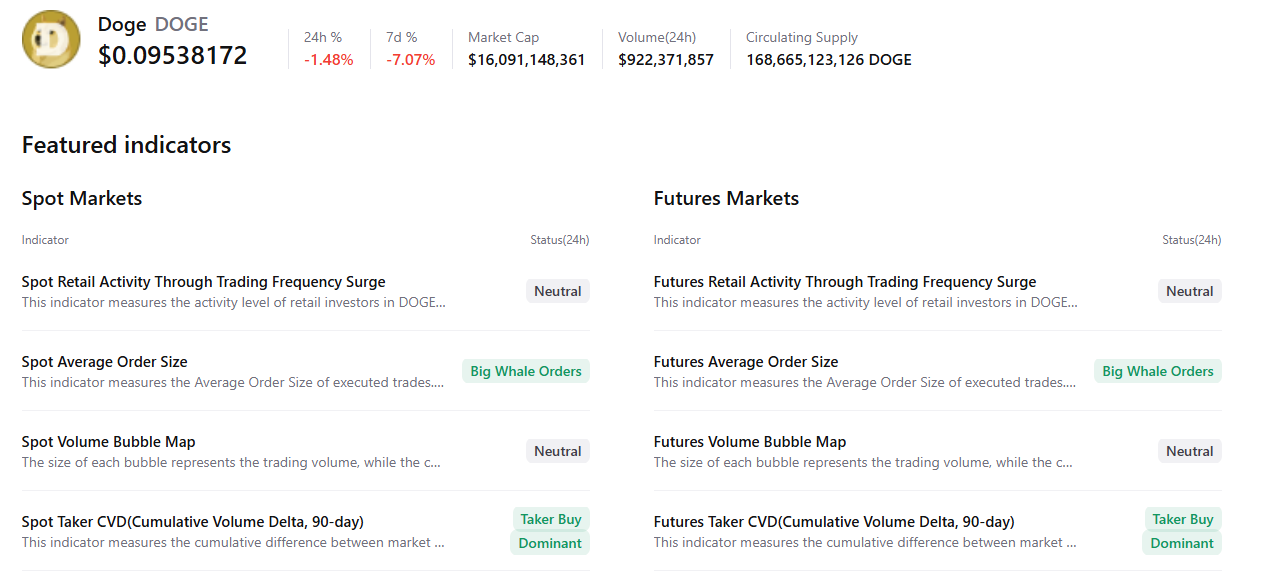
CryptoQuant’s summary data supports the positive outlook, as DOGE’s spot and futures markets show large whale orders and buy dominance, signaling a potential recovery ahead.
Dogecoin Price Forecast: DOGE revisits the lower falling wedge boundary
Dogecoin price fell more than 7% last week, bottoming at $0.080, just above the weekly support of $0.078, before rebounding on Friday to retest a previously broken trendline. DOGE faced resistance around this trendline during the weekend. At the writing on Monday, DOGE is trading at $0.095.
If DOGE breaks and closes above this trendline on a daily basis, it could extend the recovery toward the February high of 0.110.
Traders should be cautious as the primary trend for DOGE remains bearish, so any short-term recovery has a high probability of a dead-cat bounce — a brief price increase within a broader downtrend.
The Relative Strength Index (RSI) reads 32, rebounding from oversold territory and hinting at fading bearish momentum. However, bears are still in control, as the RSI must move above the neutral level of 50 for the recovery rally to be sustained. The Moving Average Convergence (MACD) lines are converging, with fading red histogram bars below the neutral level, suggesting fading bearish strength.
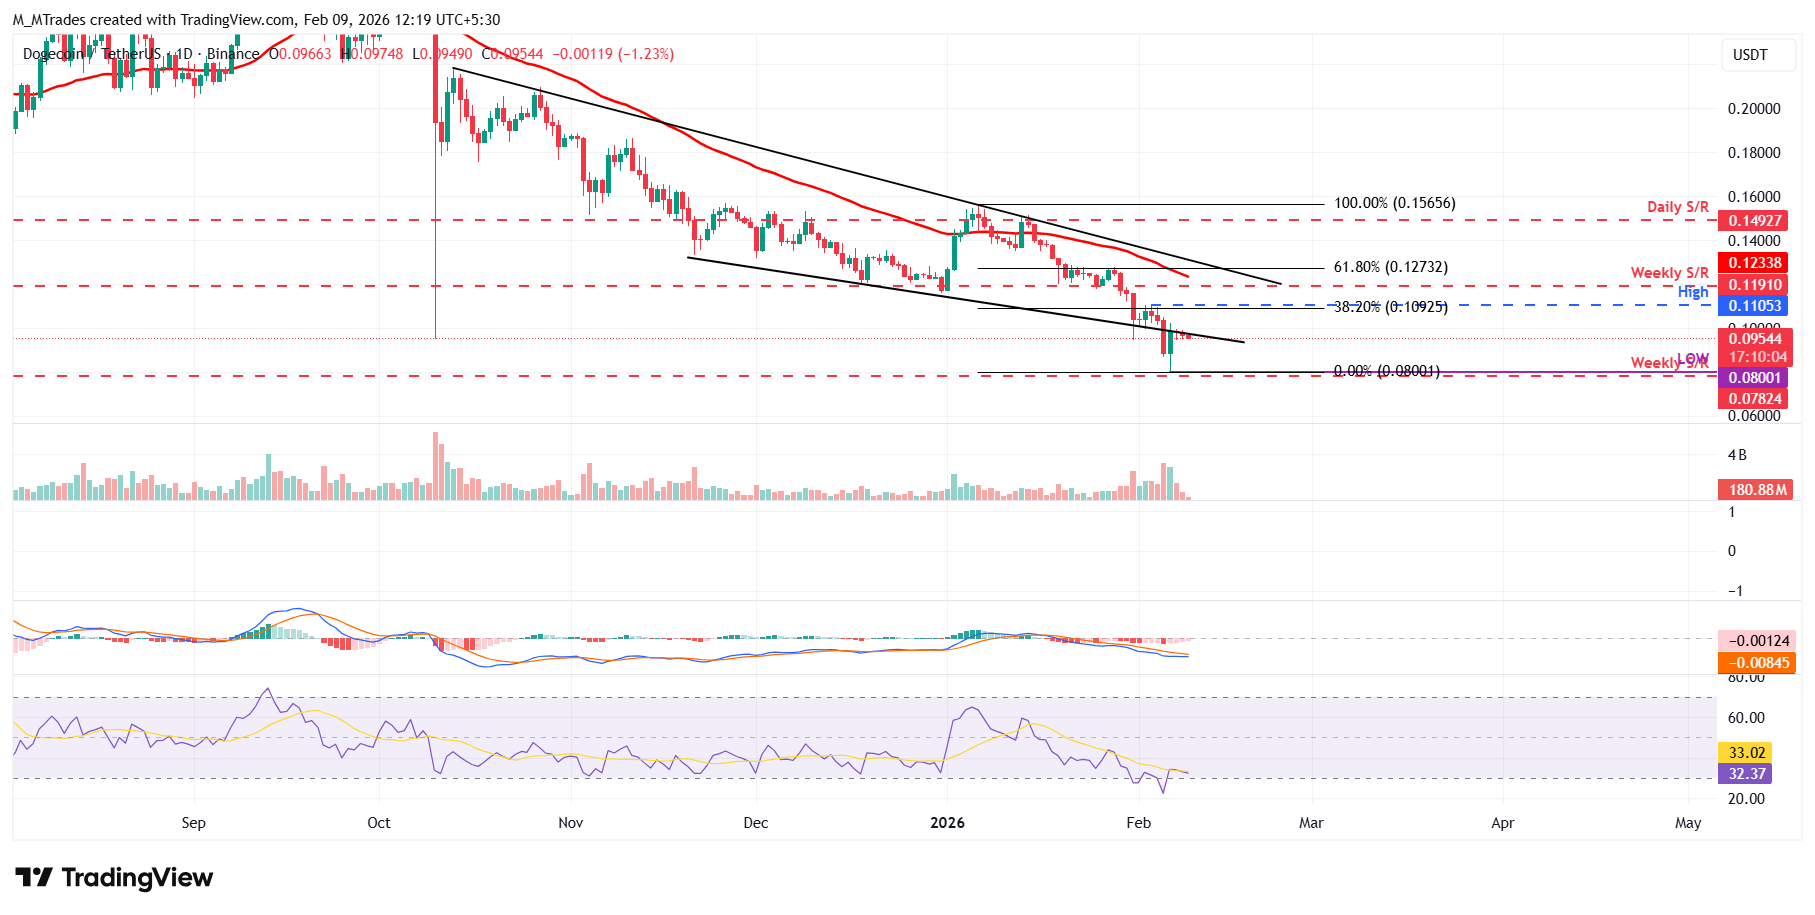
If DOGE resumes its ongoing downward trend, it could decline toward Friday’s low of $0.080. A close below this level could extend losses toward the next weekly support at $0.078.
Recommended Articles


Comments (0)
Click the $ button, enter the symbol, and select to link a stock, ETF, or other ticker.