


Cardano Price Forecast: ADA builds bearish momentum amid on-chain weakness



- Cardano price hovers $0.650 on Tuesday after falling nearly 6% over the last two days.
- On-chain data show a bearish picture as funding rates are negative and network activity is falling.
- The technical outlook suggests a correction as momentum indicators show bearish signs.
Cardano (ADA) price hovers around $0.650 at the time of writing on Tuesday after falling nearly 6% over the last two days. On-chain data supports the bearish thesis, as funding rates are negative and network activity is falling. The technical outlook suggests a correction, as the momentum indicators, the Relative Strength Index (RSI) and Moving Average Convergence Divergence (MACD) show bearish signs.
Cardano’s network activity and funding rates show a bearish bias
Coinglass's OI-Weighted Funding Rate data shows that the number of traders betting that the price of Cardano will slide further is higher than that anticipating a price increase.
This index is based on the yields of futures contracts, which are weighted by their Open Interest (OI) rates. Generally, a positive rate (longs pay shorts) indicates bullish sentiment, while negative numbers (shorts pay longs) indicate bearishness.
In the case of ADA, the metric stands at -0.0017%, reflecting a negative rate and indicating that shorts are paying longs. This scenario often signifies bearish sentiment in the market, suggesting potential downward pressure on ADA price.
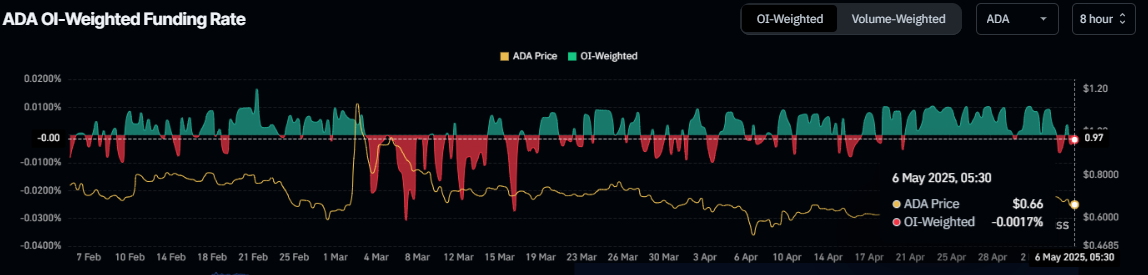
Cardano Funding rate chart. Source: Coinglass
Besides negative funding rates, Coinglass’s Daily Active Addresses index, which tracks network activity over time, also paints a bearish picture for ADA. A rise in the metric signals greater blockchain usage, while declining addresses point to lower demand for the network.
In ADA’s case, Daily Active Addresses have been extending a downtrend starting in early March and reading 21,600 on Tuesday. This indicates that demand for ADA’s blockchain usage is decreasing, which doesn’t bode well for Cardano's price.
 [08-1746504935609.34.16, 06 May, 2025].png)
Cardano daily active addresses chart. Source: Santiment
Cardano Price Forecast: Momentum indicators reflect bearish signals
Cardano price failed to close above the weekly resistance of $0.746 on April 24, leading to a correction of 8.3% over the last 12 days. At the time of writing on Tuesday, it hovers around $0.660.
If ADA continues to correct, it could extend the decline to retest its April 22 low of $0.615.
The RSI on the daily chart reads 46, below its neutral level of 50, indicating bearish momentum. The MACD indicators also show a bearish crossover on Monday, giving sell signals and suggesting a bearish trend.
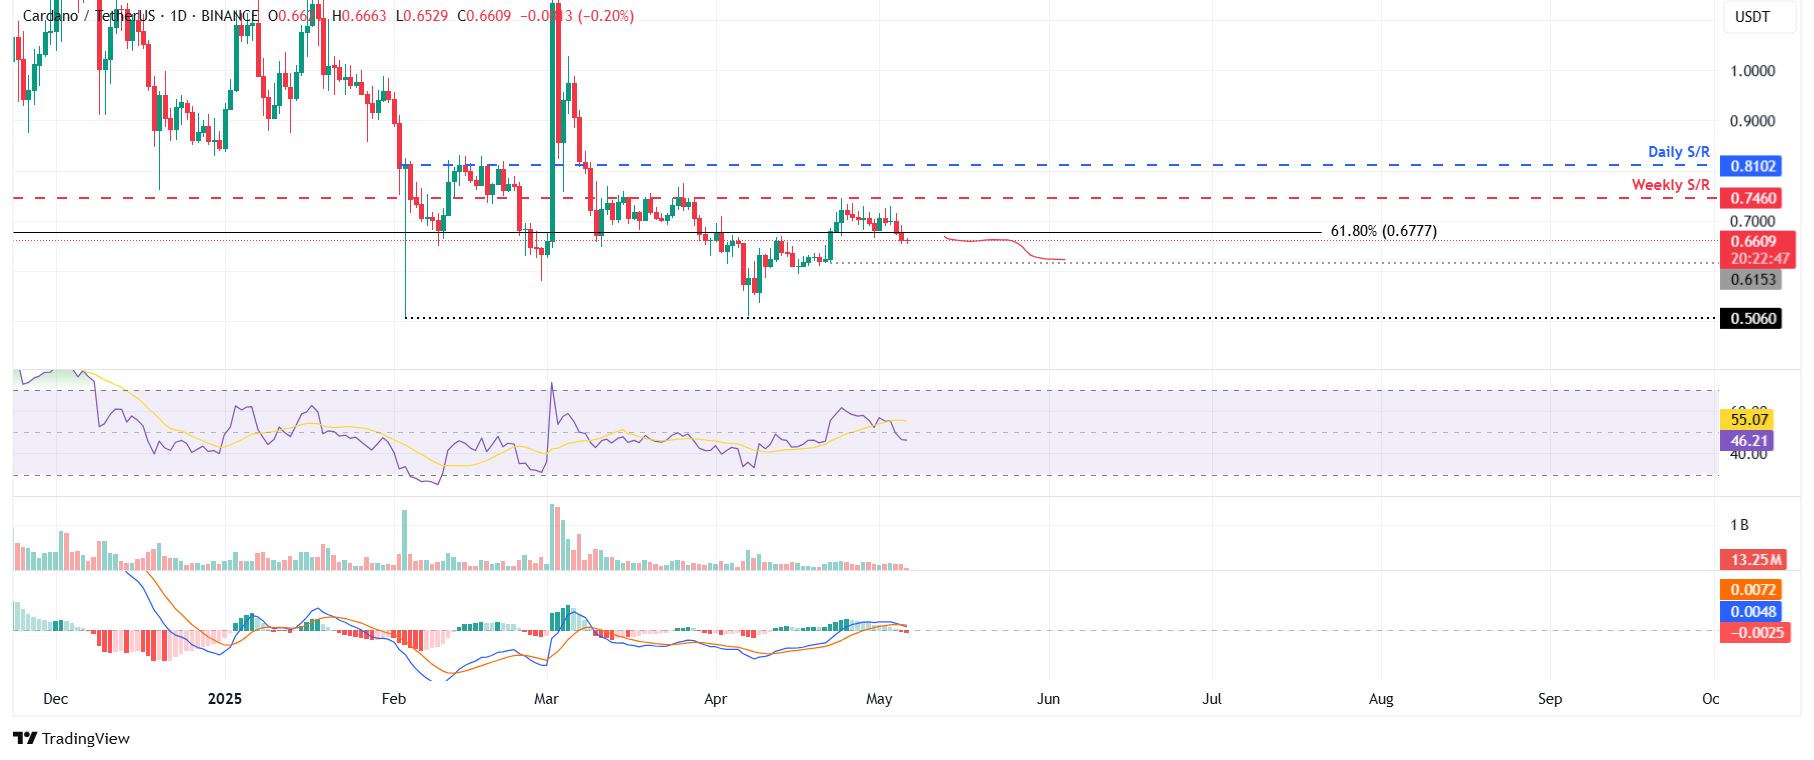
ADA/USDT daily chart
However, if ADA closes above the weekly level of $0.746, it could extend the rally to retest its next daily support at $0.810.
Recommended Articles






Comments (0)
Click the $ button, enter the symbol, and select to link a stock, ETF, or other ticker.