


Sonic Price Forecast: S bulls aim for higher leg as TVL reaches all-time high



- Sonic hovers around the $0.55 key level on Friday after rallying more than 15% the previous day.
- DefiLlama data shows that S’s TVL has reached a new all-time high of $1.54 billion.
- On-chain data suggests a bullish outlook, as Sonic’s fee collection, open interest, and stablecoins market capitalization are all increasing.
Sonic (S), previously Fantom (FTM), is hovering around $0.55 at the time of writing on Friday after rallying over 15% the previous day. DefiLlama data shows that S’s Total Value Locked (TVL) has reached a new all-time high, while other on-chain data suggests a bullish outlook, as Sonic’s fee collection, open interest, and stablecoin market capitalization are rising.
Sonic TVL, open interest and chain fees hit a new all-time high
Data from crypto intelligence tracker DefiLlama shows that S’s TVL increase reached a new all-time high (ATH) of $1.54 billion on Friday. This increase in TVL indicates growing activity and interest within the Sonic ecosystem, suggesting that more users are depositing or utilizing assets within S-based protocols.
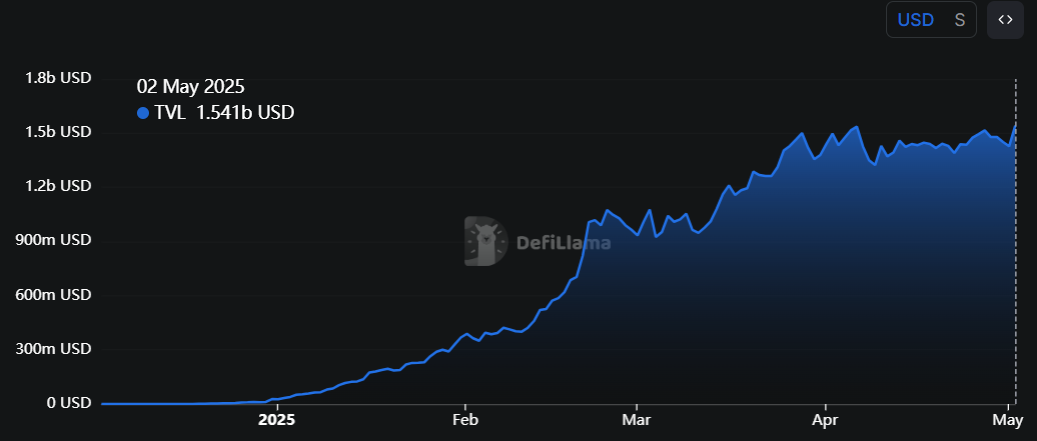
S TVL chart. Source: DefiLlama
Another factor bolstering the platform’s bullish outlook is a recent surge in traders’ interest and liquidity on the S chain, which generated chain fees of $37,750 on Thursday, marking a new ATH.
Additionally, its stablecoin market capitalization has been steadily rising since mid-April and currently stands at $538.20 million as of Friday. Such stablecoin activity and value increase on the S project indicate a bullish outlook, as they boost network usage and can attract more users to the ecosystem, driven by Decentralized Finance (DeFi) and payment use cases.
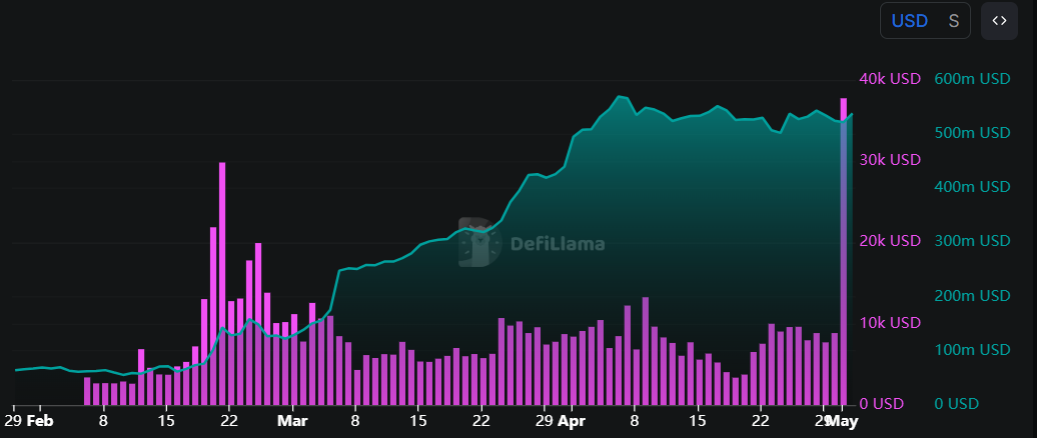
S chain fees and stablecoins market cap chart. Source: DefiLlama
Sonic’s Open Interest (OI) further supports the bullish outlook. Coinglass’s data shows that the futures’ OI in S at exchanges rose from $94.22 million on Thursday to $140.32 million, a new ATH, on Friday. An increasing OI represents new or additional money entering the market and new buying, which should contribute to a price increase.
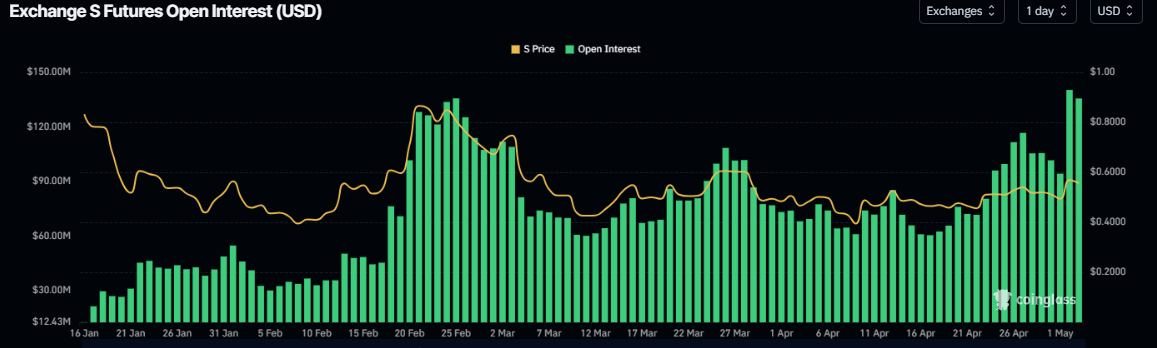
S open interest chart. Source: Coinglass
Sonic Price Forecast: S bulls aim for $0.61 if support holds strong
Sonic price broke above its daily resistance level at $0.55 and rallied more than 15% on Thursday. At the time of writing, it trades slightly down from this level.
If the $0.55 level holds, S could extend a rally toward the next resistance level at $0.61. A successful close above this could extend additional gains toward $0.68, the 50% Fibonacci retracement level drawn from the February high of $0.99 to the April low of $0.37.
The Relative Strength Index (RSI) on the daily chart reads 57, above its neutral level of 50, indicating bullish momentum. The MACD indicator also displayed a bullish crossover last week, providing buy signals and indicating a potential continuation of the upward trend.
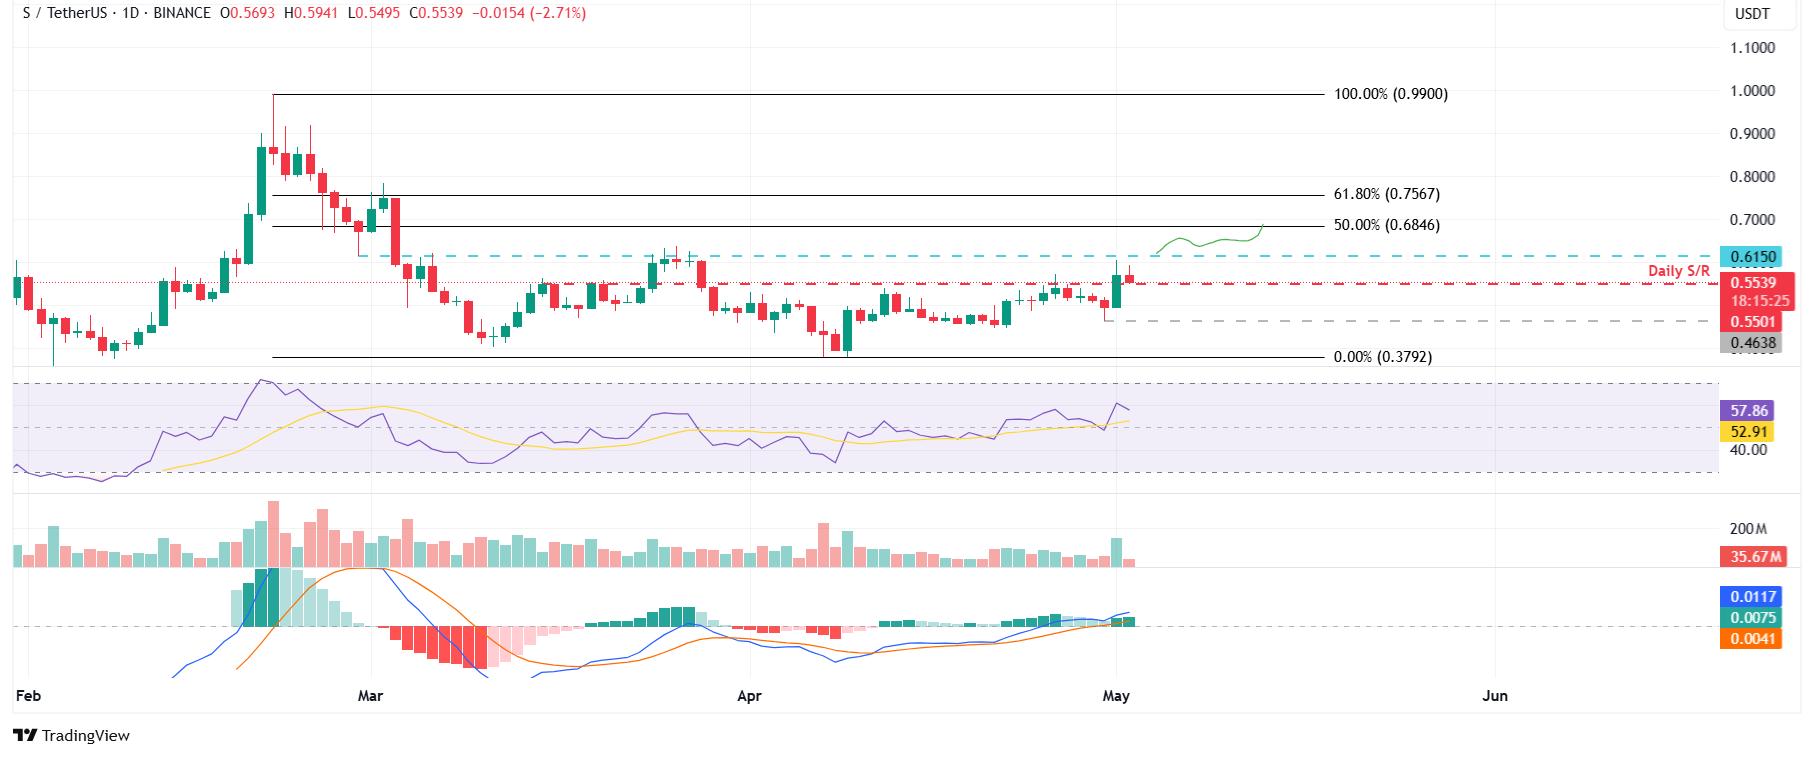
S/USDT daily chart
However, if S fails to find support around $0.55, it could extend the decline to retest its Wednesday low of $0.46.
Recommended Articles







Comments (0)
Click the $ button, enter the symbol, and select to link a stock, ETF, or other ticker.