


Solana and Litecoin Price Prediction: SOL shows bearish signs, LTC approaches key resistance



- Solana futures and spot markets reveal modest bearish signs despite a slight price increase on Thursday.
- After posting a V-shaped reversal, SOL maintained its consolidation near the $150 level.
- Litecoin eyes recovery of the $90 and $95 key levels as it attempts to complete an ascending triangle pattern.
Solana (SOL) saw a 3% gain and Litecoin (LTC) rose 6% on Thursday following a market-wide recovery across cryptocurrencies. On-chain and technical indicators of the two altcoins show key price levels to watch out for as the market recovers.
Solana derivatives and spot market hint at downside pressure
In the futures market, SOL's funding rates flashed negative within the past few hours, indicating rising short positioning among investors, per Coinglass data. This marks the continuation of a pattern that SOL's futures have established in the past few weeks.
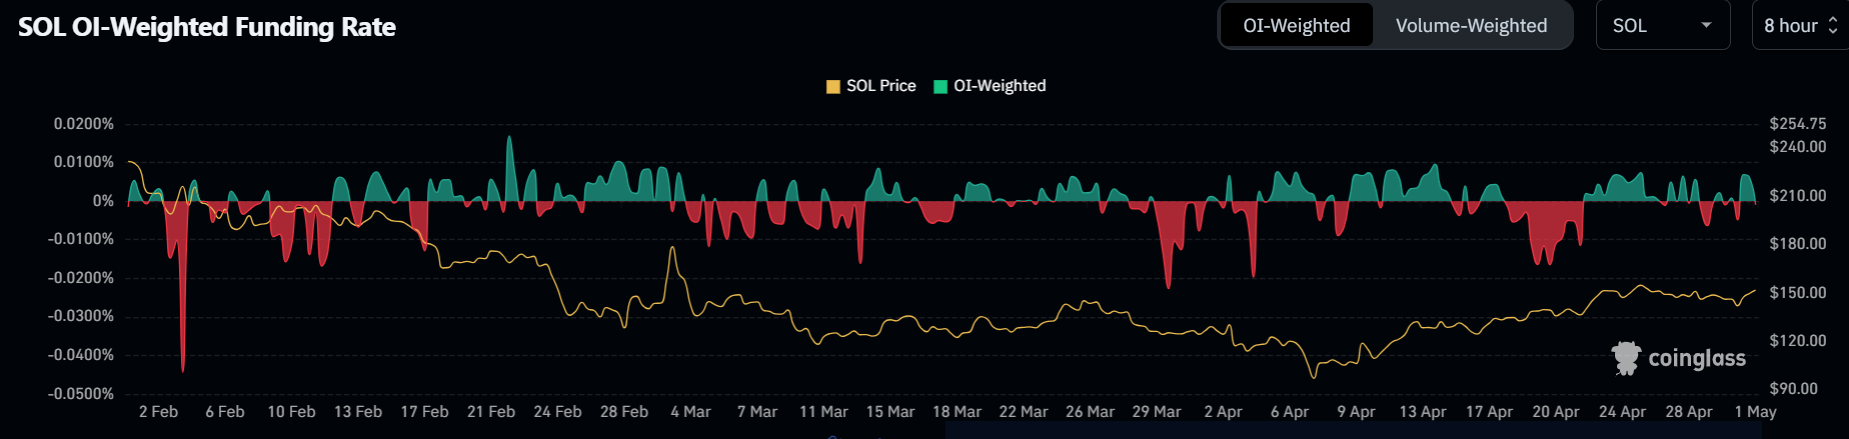
SOL Funding Rates. Source: Coinglass
Funding rates are periodic payments between long and short investors to keep the prices of futures contracts on par with their underlying assets.
A similar trend is visible in the SOL spot market, where exchange inflows have risen in the past 24 hours. An increase in exchange inflows signifies rising selling activity.
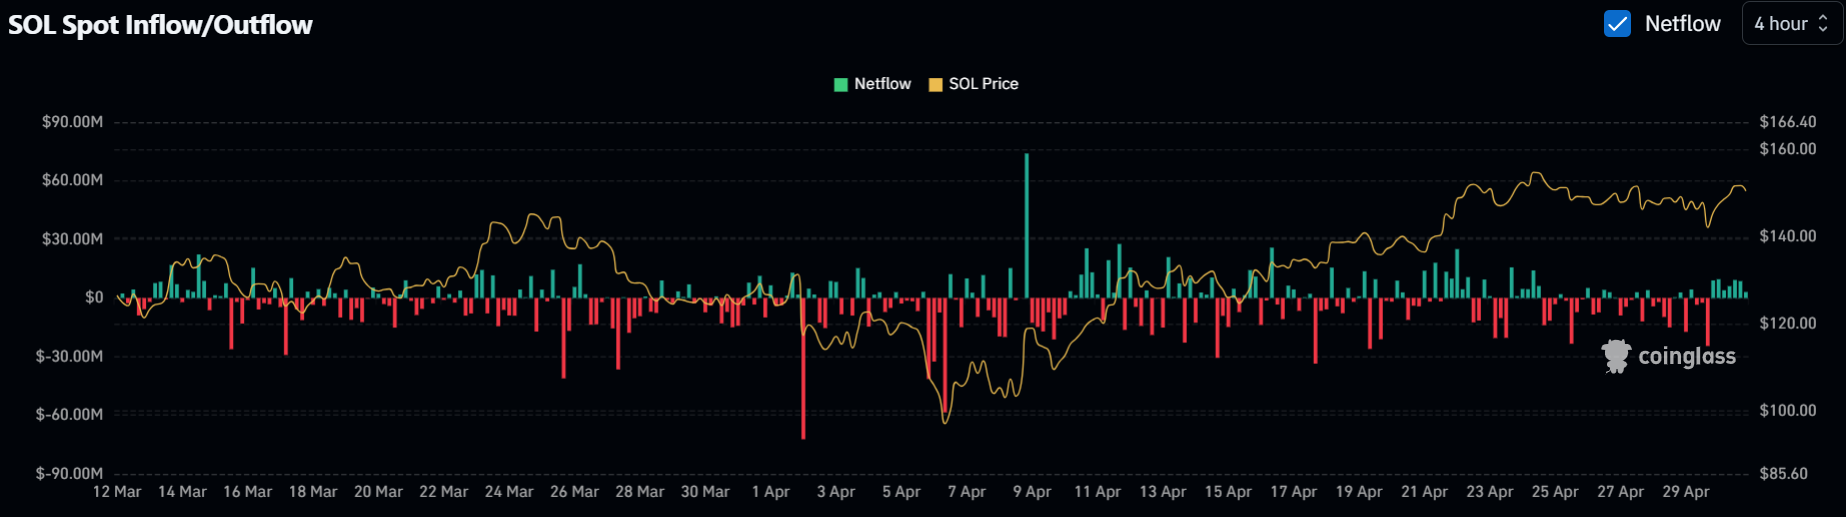
SOL Exchange Inflows. Source: Coinglass
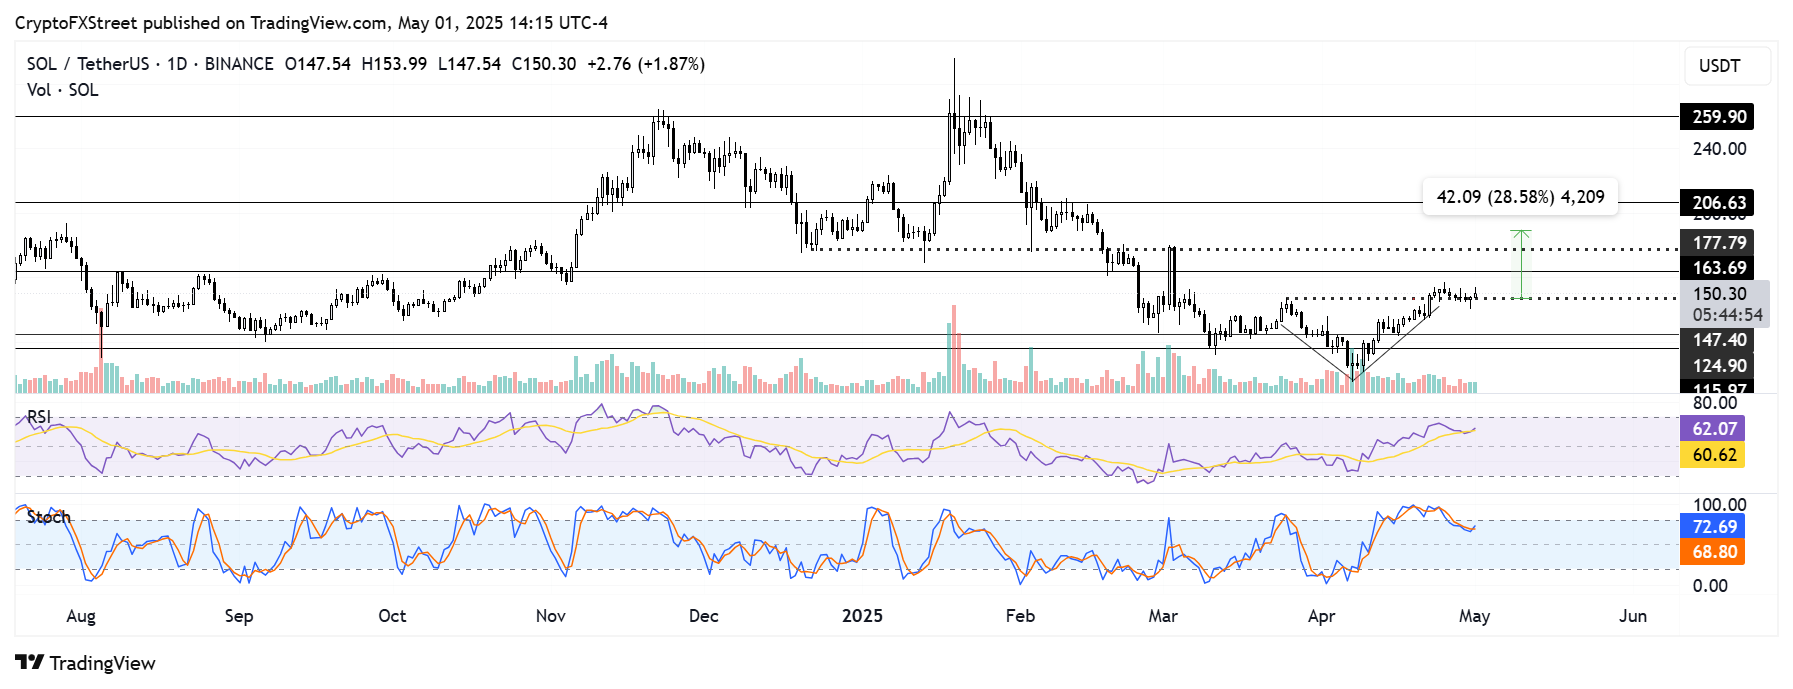
On the technical side, Solana has been consolidating near the $150 psychological level for over a week after posting a V-shaped reversal between March 25 and April 22. This pattern signifies a bullish reversal where prices decline sharply and quickly recover.
SOL/USDT daily chart
A high volume recovery of $150 and subsequent move above the $163 resistance could send SOL above $177. On the downside, SOL could find support near $125 if it loses the $147 support.
The Relative Strength Index (RSI) and Stochastic Oscillator (Stoch) are above their neutral levels, indicating dominant bullish momentum.
Litecoin tests $90 resistance as bulls eye recovery above $95
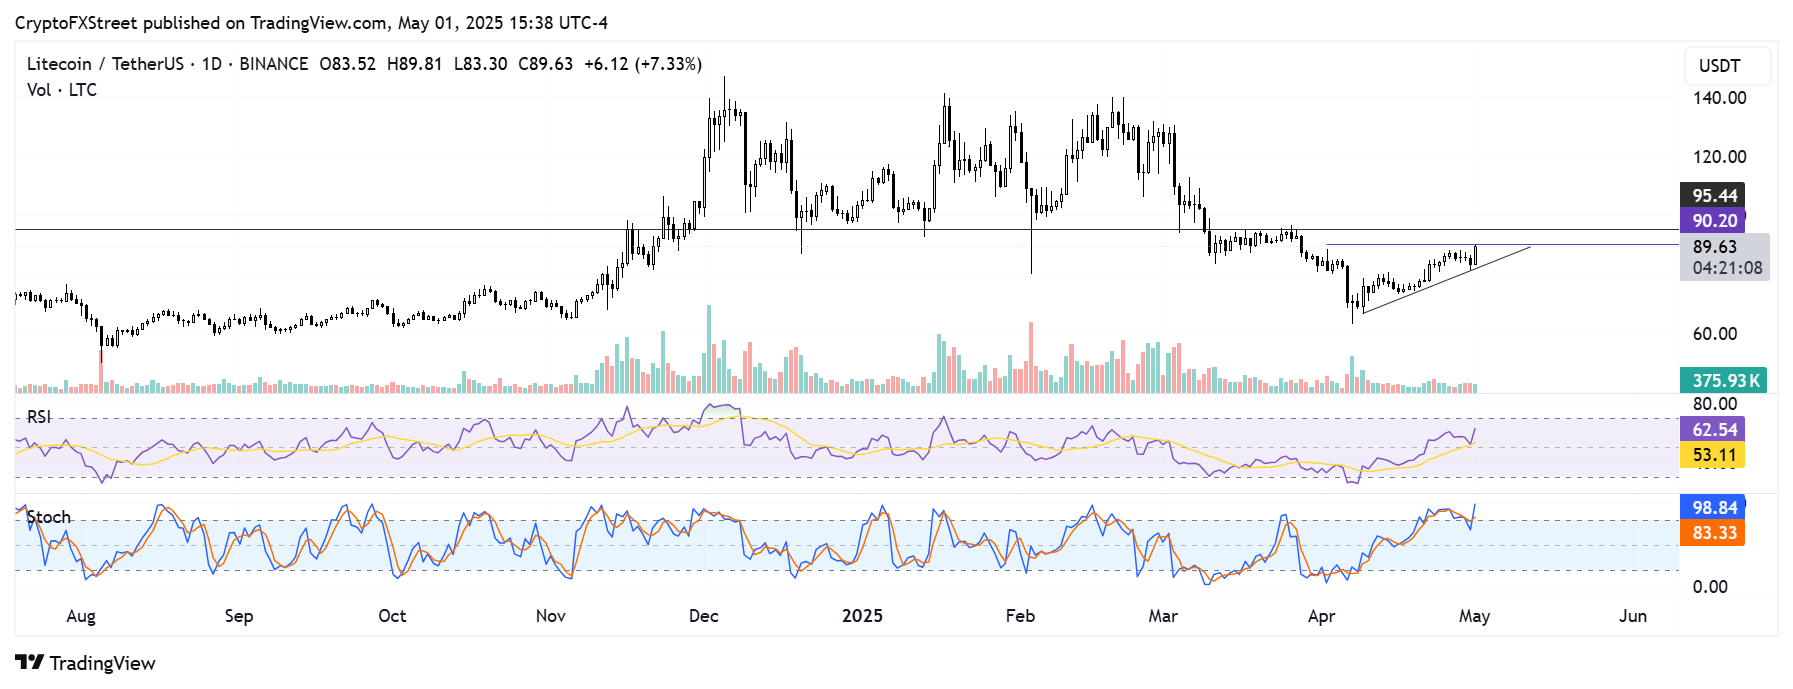
Litecoin has been trading within an ascending triangle pattern, rising gradually since April 9. The $95 level stands as a major resistance, considering LTC saw a rejection near it several times in March.
LTC/USDT daily chart
In the short term, LTC has to recover the $90 psychological level to fuel further bullish momentum and propel its price to test $95. A firm move above $95 could mark the beginning of a major recovery for the altcoin.
Considering that trading volume is still low, watching for a potential false breakout is important.
On the downside, LTC could see a short-term rejection near the $90 level. The Stoch entering the overbought region aligns with such a potential move.
The Global In/Out of the Money metric shows that $95 falls within Litecoin's largest historical demand range — $88 to $99 — where investors purchased over 13.13 million LTC, per IntoTheBlock's data.
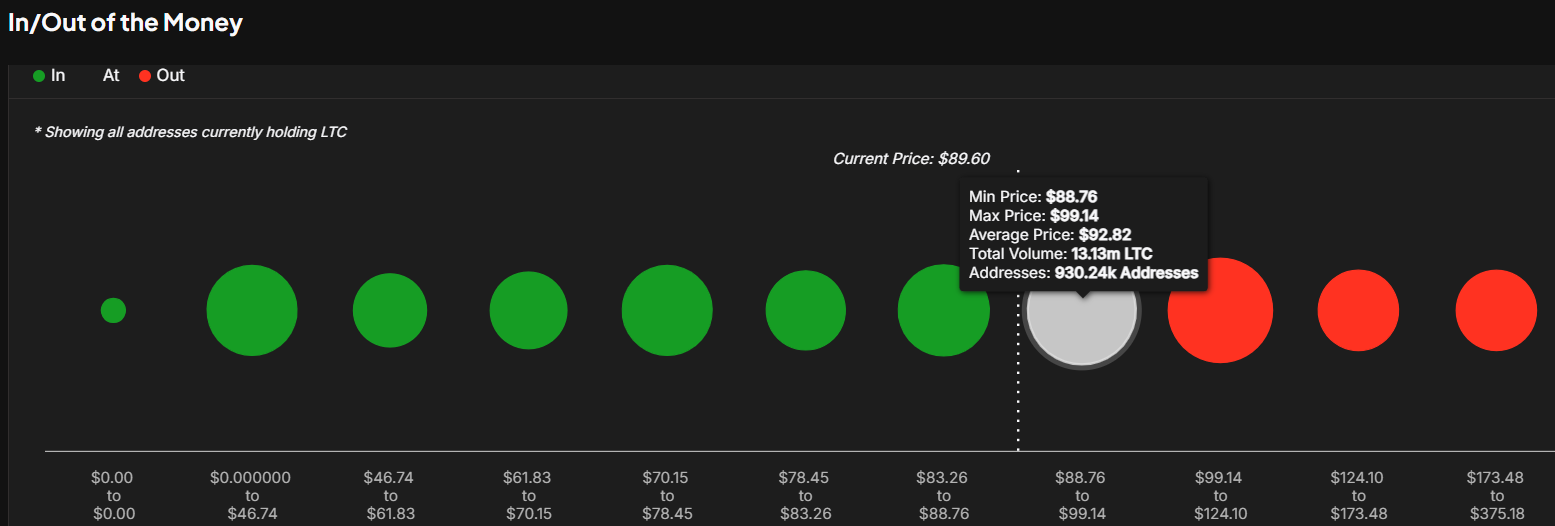
LTC Global In/Out of the Money. Source: IntoTheBlock
Historically, recovery of such levels either sees investors defending prices from falling below their cost basis or sparking a huge sell pressure immediately after they break even.
Recommended Articles









Comments (0)
Click the $ button, enter the symbol, and select to link a stock, ETF, or other ticker.