

EUR/MXN Price Prediction: Potential Bull Flag forming

FXStreetOct 21, 2024 1:50 PM
View all comments(0)
- EUR/MXN has probably formed a Bull Flag price pattern.
- Such patterns signal the likelihood of more upside evolving.
EUR/MXN appears to be forming a Bull Flag price pattern, most clearly visible on the daily and weekly charts. Bull Flags are bullish continuation patterns.
EUR/MXN Daily Chart
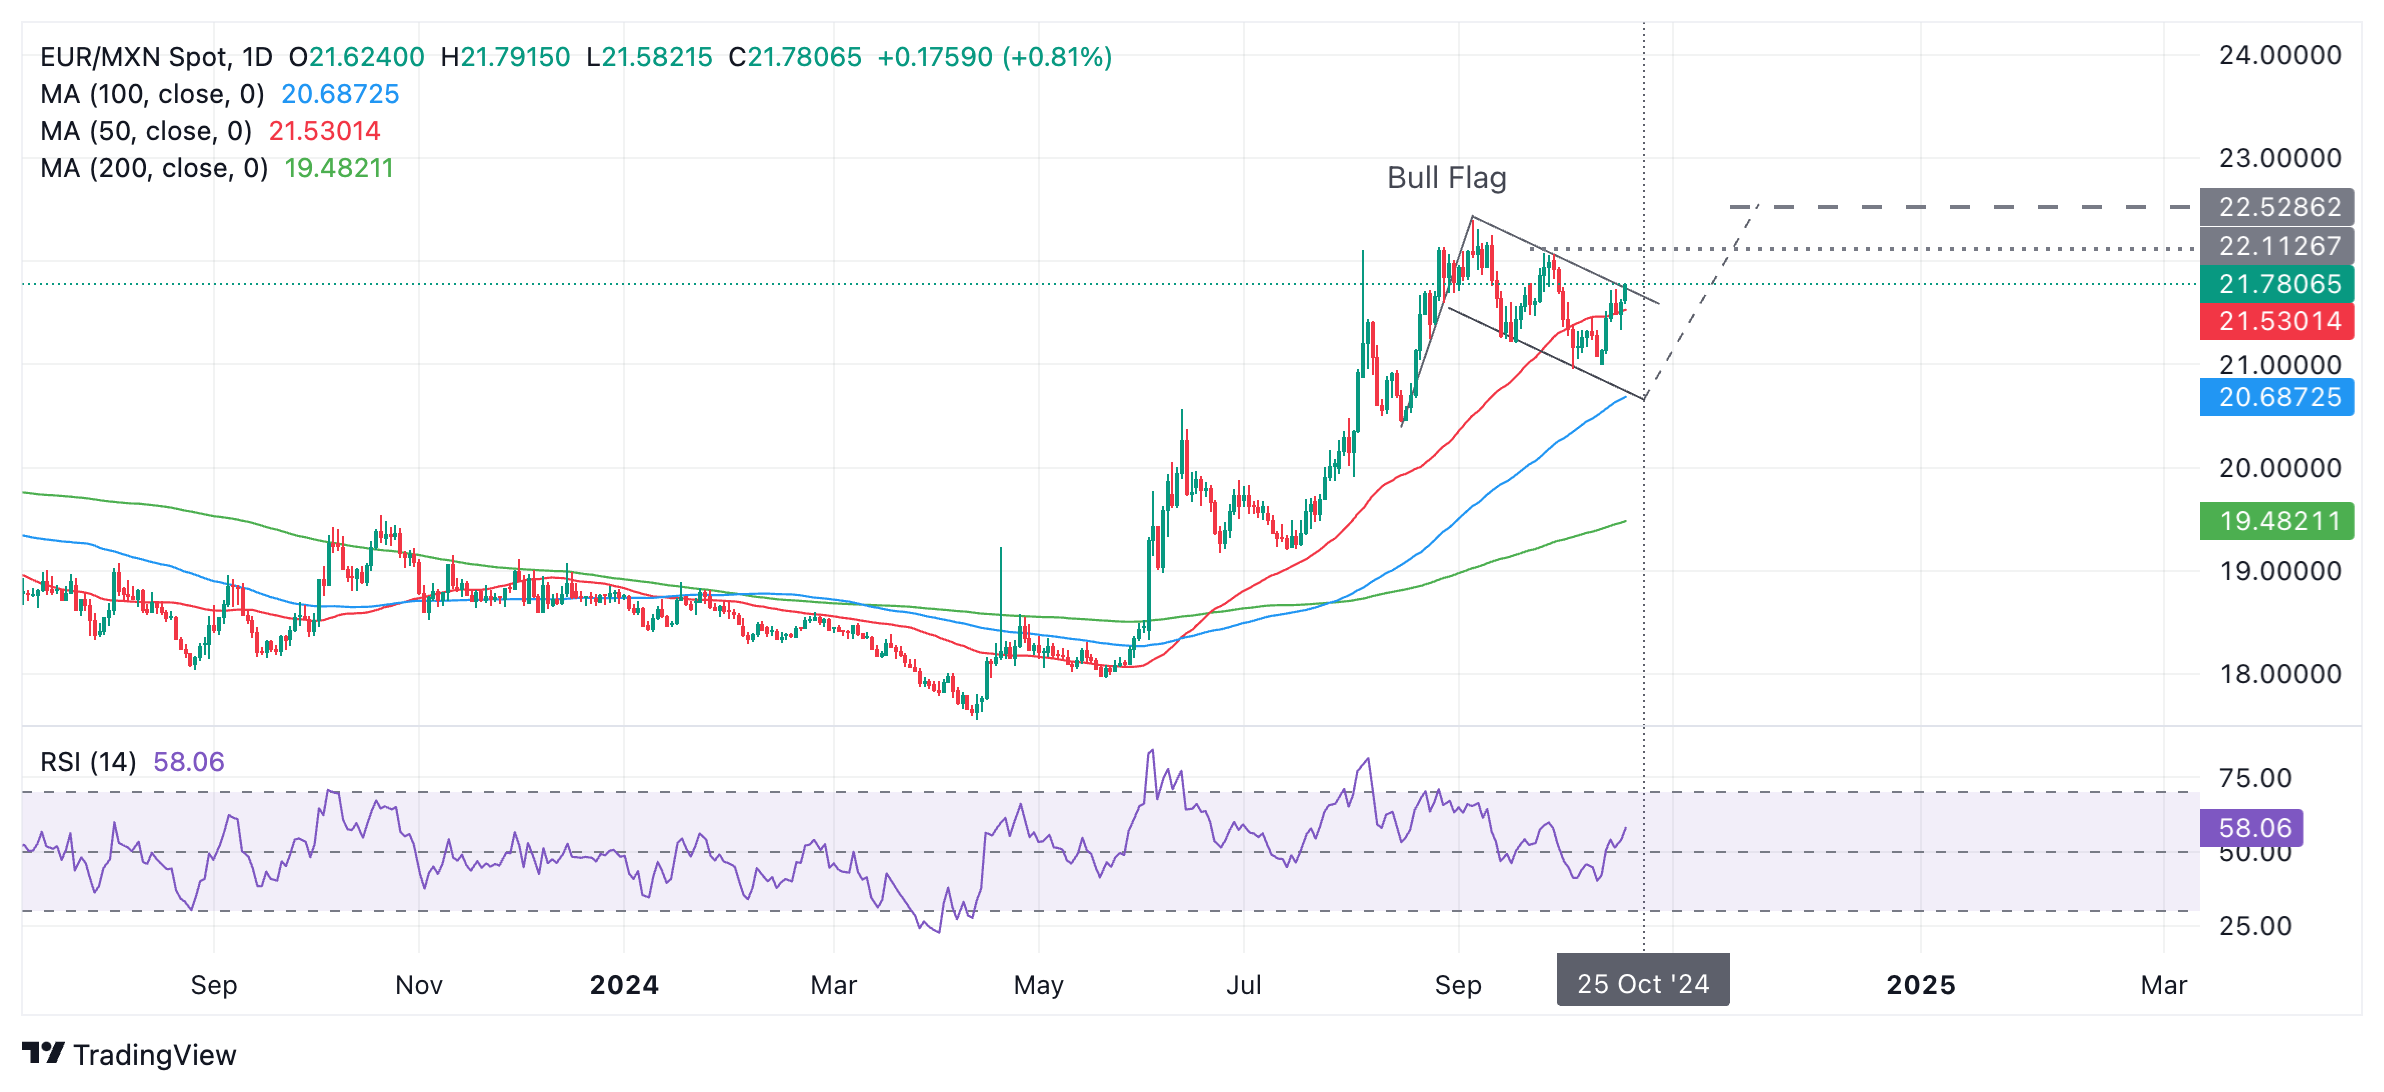
The “flag pole” part of the pattern probably began at the August 15 lows and the “flag square” part has been developing since price peaked on September 5.
A breakout from the flag square would confirm the completion and activation of the Bull Flag. This, in turn, would and probably signal more upside towards a target at around 22.52 (Grey dashed line). This is equal to the length of the pole extrapolated higher. A break above the 22.07 September 26 high would confirm the extension.
Disclaimer: The information provided on this website is for educational and informational purposes only and should not be considered financial or investment advice.
Like
Recommended Articles


Featured Tools


Top News

South Korean Stocks Face Another Bloodbath: Kospi Tumbles 4%, Samsung and SK Hynix Slump Over 3%

Intel (INTC) Q2 Earnings Thursday; Up 163% YTD, Options Price 15% Swing

Musk Just Announced Starship Launch This Thursday, Will SpaceX Share Price Soar or Hit New Low?

Alphabet (GOOGL) Week Review: EU Hit, Gemini Delays, Earnings Wednesday

Tesla (TSLA) Q2 Earnings Wednesday — 480K Deliveries, 7.6% Options Swing

Comments (0)
Click the $ button, enter the symbol, and select to link a stock, ETF, or other ticker.