


UBER: Rides Slow; Can Eats Hold Up?


$Uber Tech(UBER.US) released its Q3 2026 results pre-market on Nov 4 ET. The print was mixed: core GBV came in slightly light, with rides weaker and delivery stronger. On profitability it flipped, as rides margins kept expanding while delivery margins slipped. Specifically:
1) Core GBV: slower volume hurt, price mix offset part of the drag
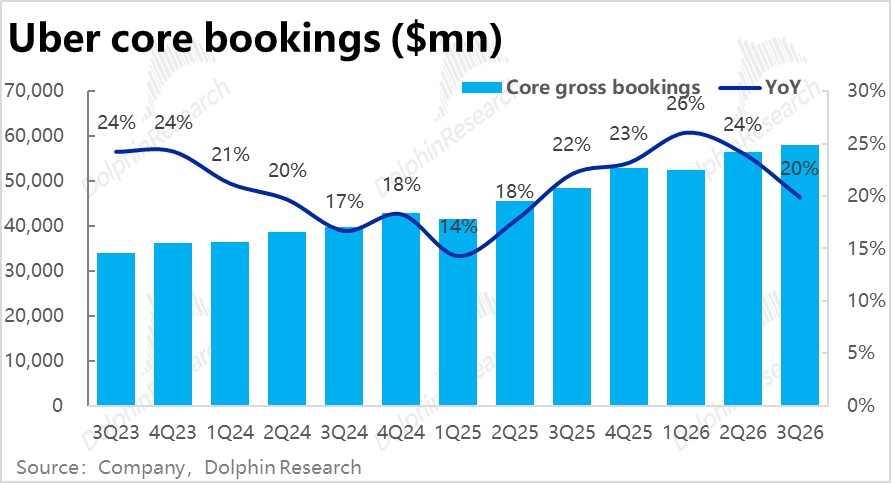
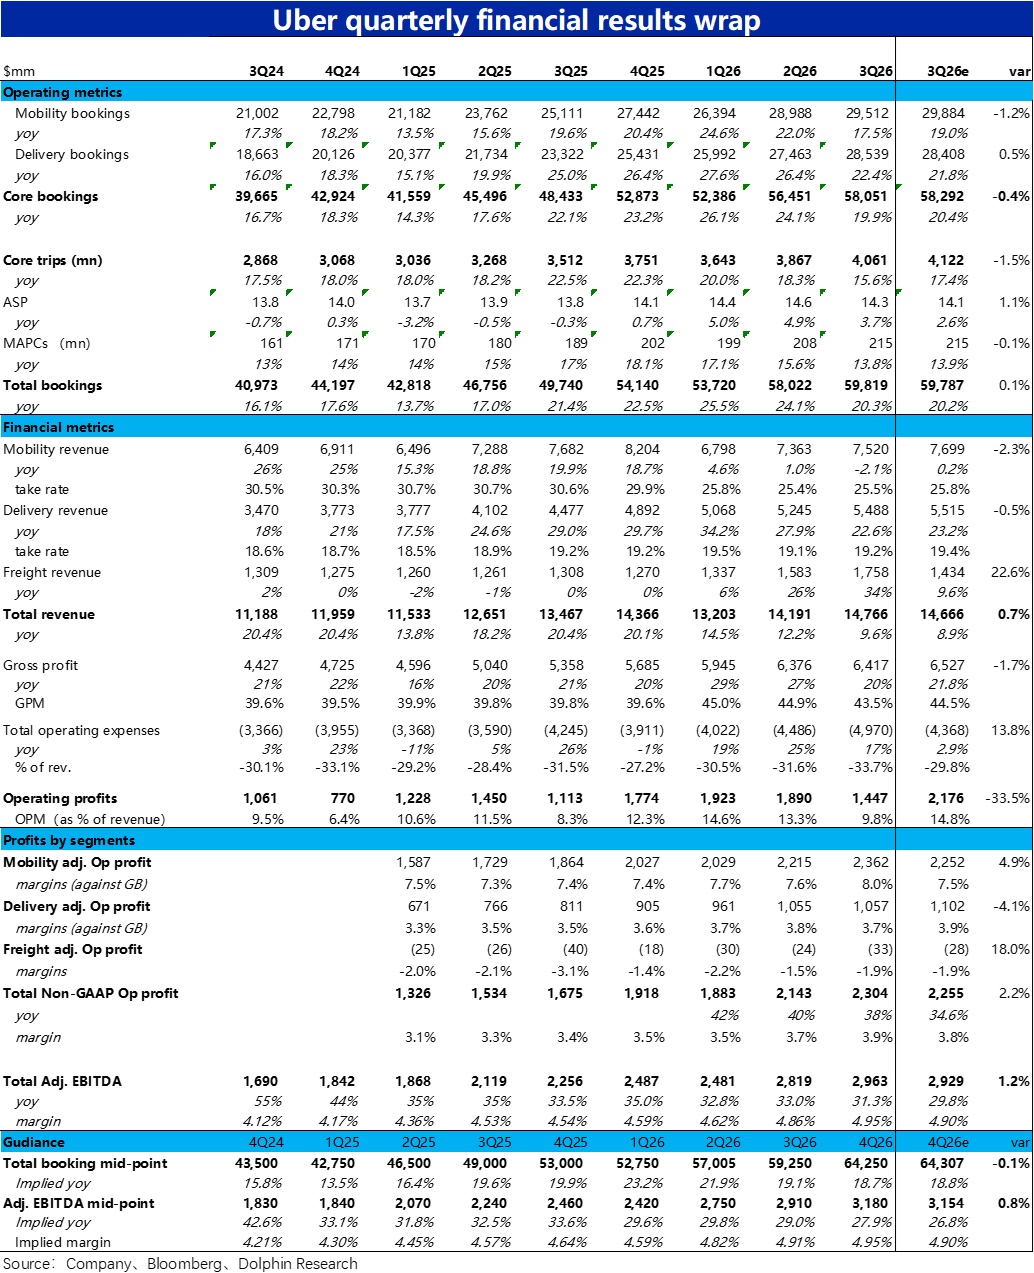
Total GBV was $59.8bn, up 20% YoY at constant FX and broadly in line with Street, but decelerating by about 2pt vs. last quarter. Ex-freight, core GBV for rides plus delivery trailed expectations by ~0.4%.
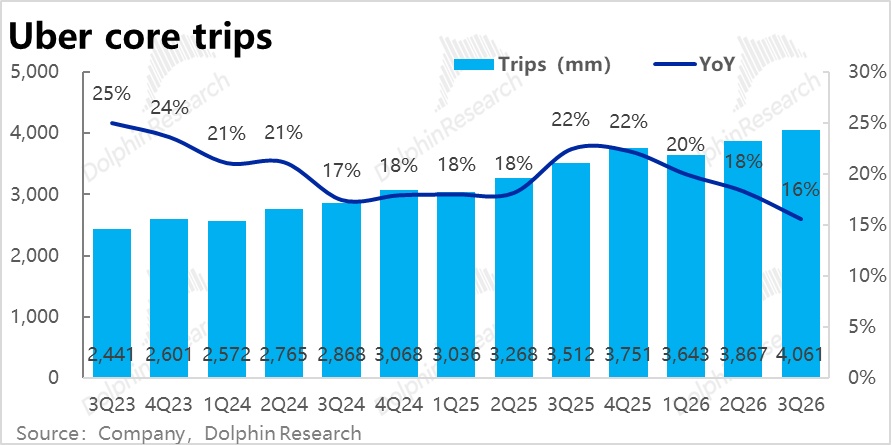
By volume and price, core GBV (delivery + rides) decelerated mainly due to softer volume. Orders rose 16% YoY, nearly 3pt slower than last quarter and decelerating for a third straight quarter. Monthly active users were up 14% YoY and also slowed for a third quarter, as new user adds cooled.
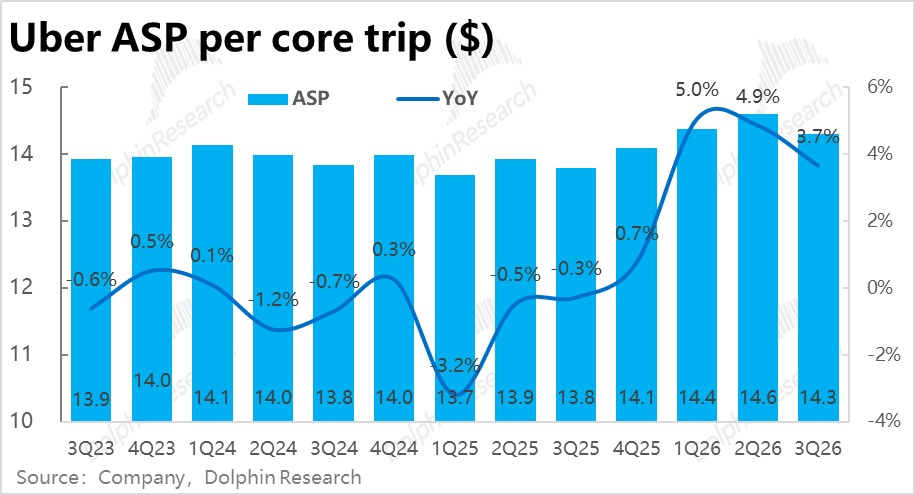
On pricing, avg. order value rose 3.7% YoY, partially offsetting the volume drag. Management highlighted mix shift: more orders skewed to the U.S., delivery, and premium rides, and faster growth in corporate mobility (about +50%) and grocery (about +40%).
The slowdown was attributed half to driver shortages in several Intl markets (India, Brazil, etc.), and half to the fading boost as Turkey’s Trendyol Go lapped the acquisition comp in delivery.
2) Rides: GBV and revenue missed
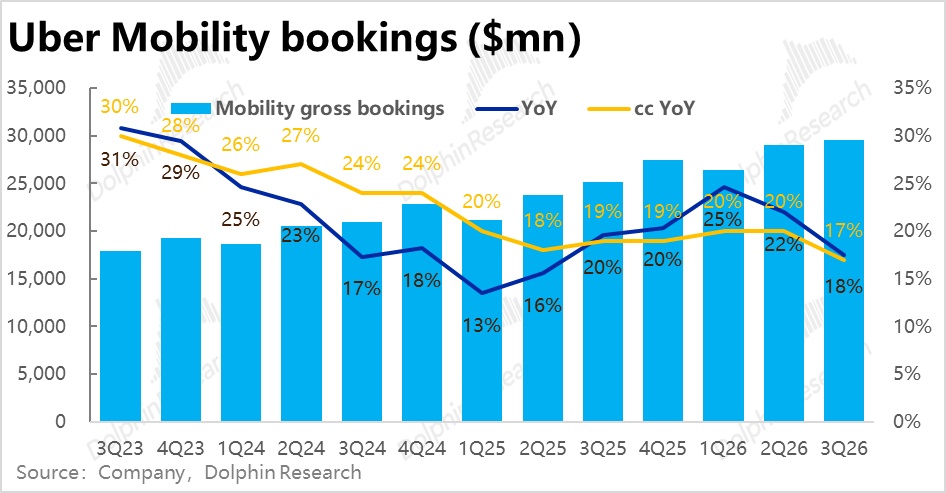
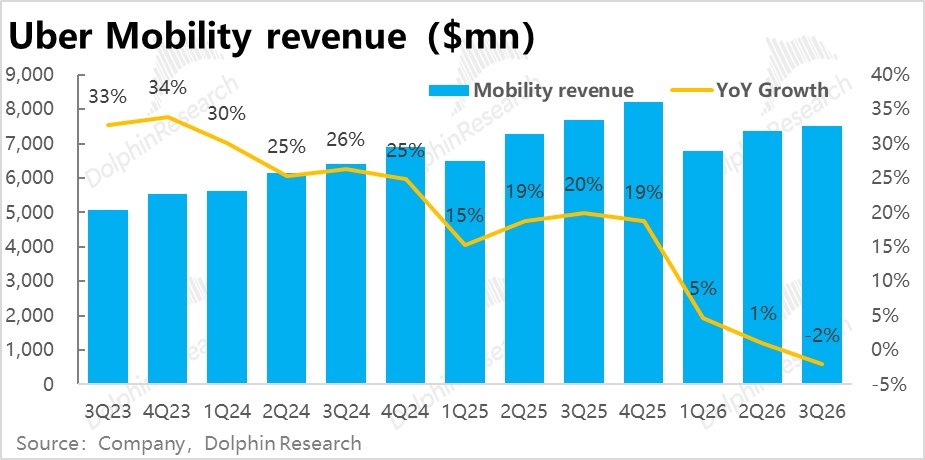
Rides GBV was $29.5bn, up 17% YoY at constant FX, about 3pt slower QoQ and ~1% below Street. Segment revenue was $7.5bn, also 2.3% below expectations.
Revenue fell about 2% YoY, with the decline mainly driven by a U.K. accounting change reclassifying driver payouts from COGS to contra-revenue, dragging take rate by ~350bps this quarter. That change was already anticipated, so the miss still stemmed from softer underlying order growth.
Management pointed to supply constraints in rides: higher fuel costs, tight local labor markets, and competition for drivers from other platforms. The U.S. only saw a mild slowdown, with tailwinds from lower insurance costs still benefiting economics.
3) Delivery: solid GBV, but take rate eased
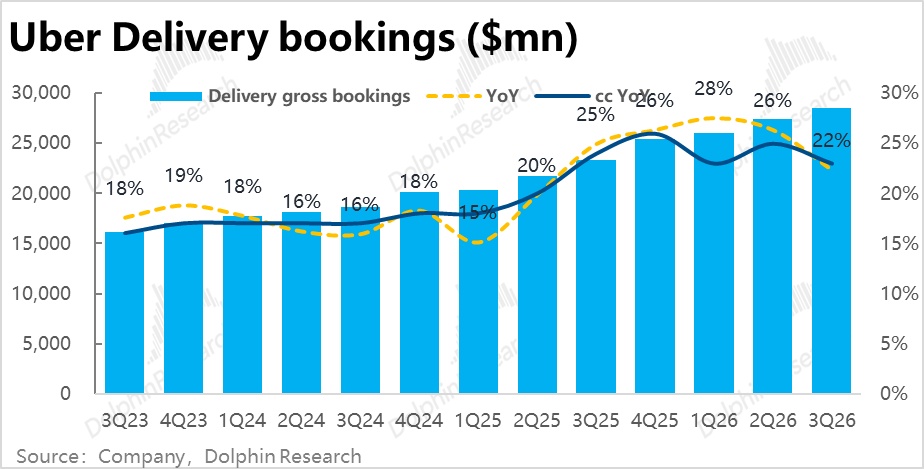
Delivery GBV reached $28.5bn, up 23% YoY at constant FX, about 2pt slower QoQ but slightly above estimates. The prior Trendyol Go acquisition is now in the base, easing its lift, while Getir (consolidated in Q3) and Careem (consolidated end-Jul) were added this quarter with limited scale and impact.
Management said that excluding M&A effects, underlying growth is still accelerating. Drivers included grocery at about +40% YoY for multiple quarters, with Costco among the top merchants by GMV. The biggest challenge is whether courier supply can keep up with demand.
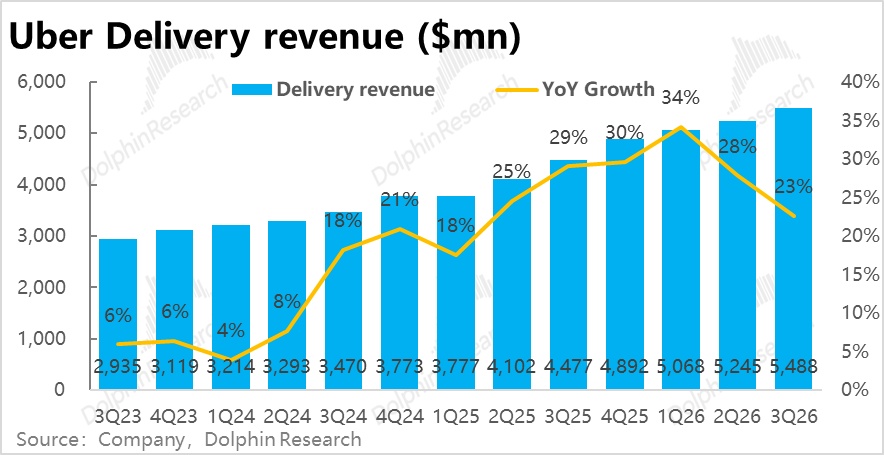
Despite healthy GBV, delivery revenue was ~0.5% below expectations, mainly due to a lower-than-expected take rate that was flat YoY. Based on management commentary, heavier investment in value led to higher user subsidies, which reduced reported revenue.
4) Freight: revenue well above, limited impact overall
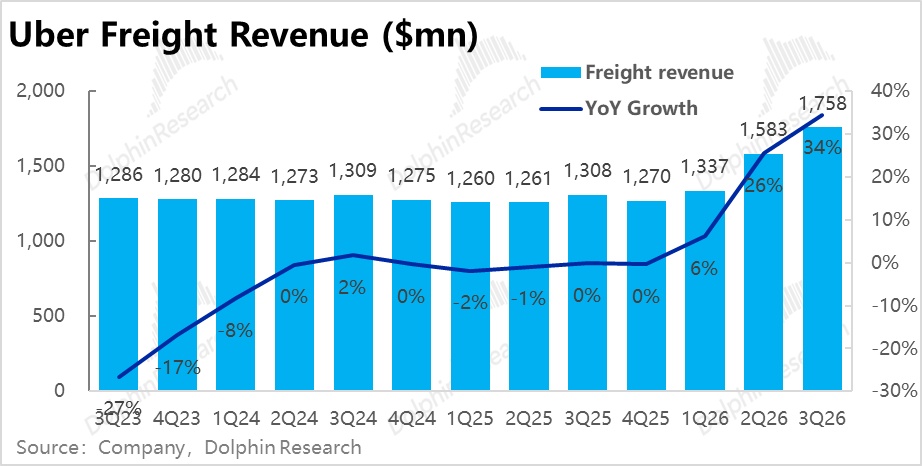
Freight revenue was $1.76bn, up 34% YoY and about 23% above Street, accelerating for a third straight quarter. Management cited strong demand from large enterprise clients and expansion in Europe, as well as AI-driven efficiencies.
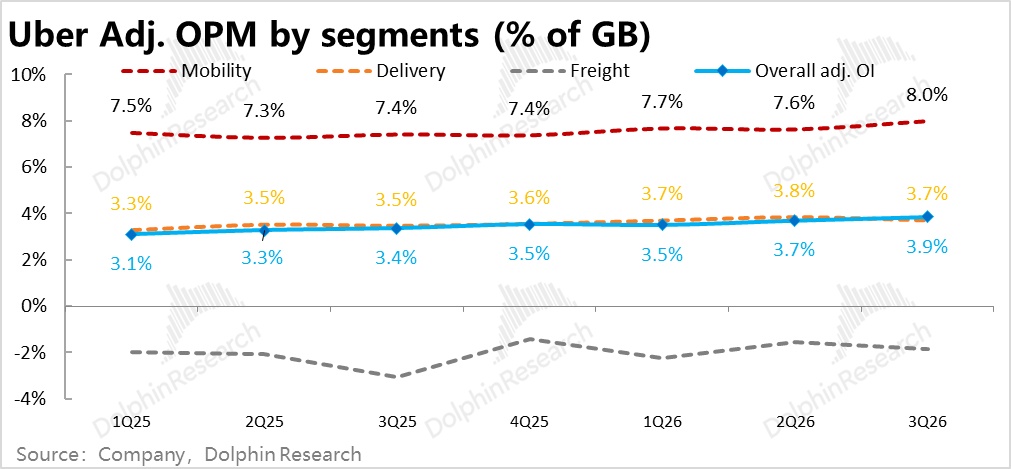
Freight accounts for only about 3% of total GBV, and segment OP was still a loss of roughly $33mn, roughly in line with expectations. Overall impact remains limited.
5) Segment profitability: rides margin at a new high, delivery down QoQ
In contrast to growth, where delivery outperformed and rides lagged, profitability saw rides stronger and delivery softer.
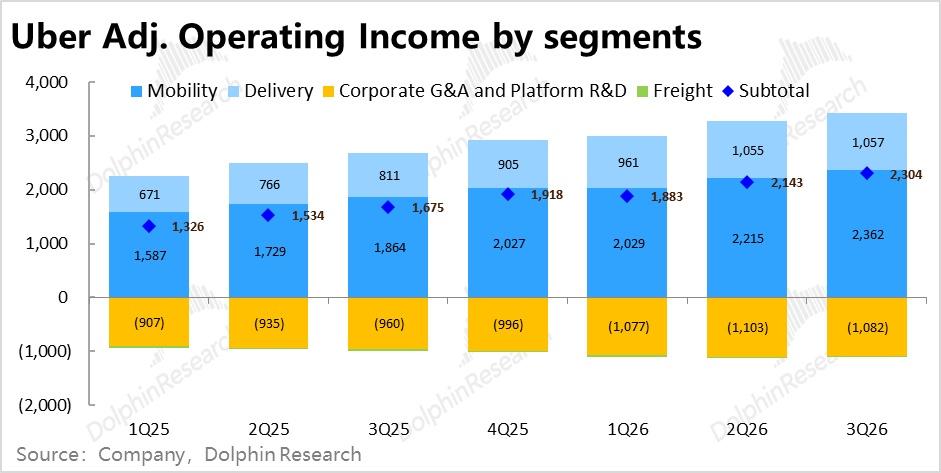
Rides segment OP was $2.36bn, about 5% above Street. Margin as a percent of GBV reached 8.0%, up about 0.4pt QoQ and a new high. Dolphin Research believes this was driven by U.S. insurance reform lowering costs, and a mix shift toward high-margin U.S. and premium rides, which offset higher subsidies.
Delivery segment OP was $1.06bn, about 4% below Street, with margin at 3.7%, down about 0.1pt QoQ. Dolphin Research estimates the drag likely came from higher subsidies and the consolidation of lower-margin Getir and Careem.
6) Costs and overall profit: opex grew far slower than GBV, supporting margins
GP was $6.4bn, about 2% below expectations. GPM was 43.5%, up about 3.7pt YoY, largely due to the U.K. accounting change; on a GBV basis, GPM was about 10.7%, roughly flat YoY in real terms.
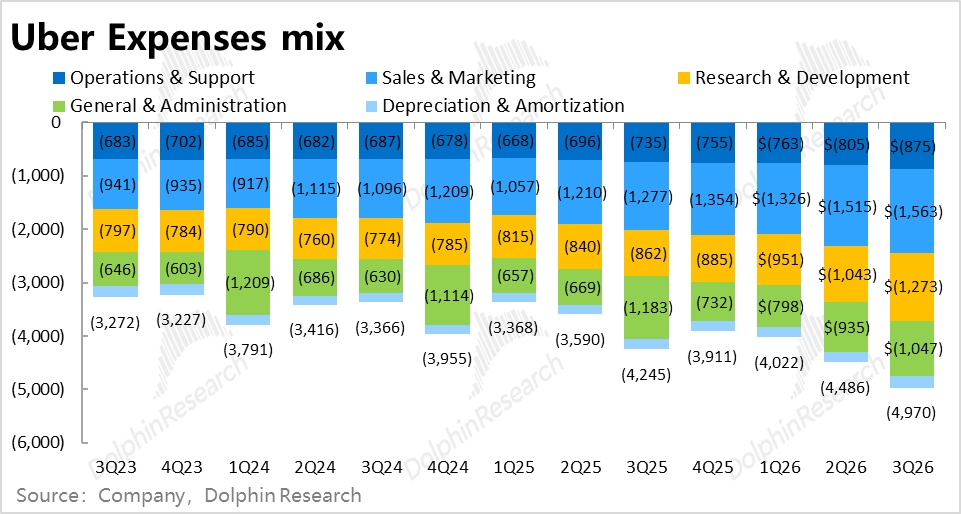
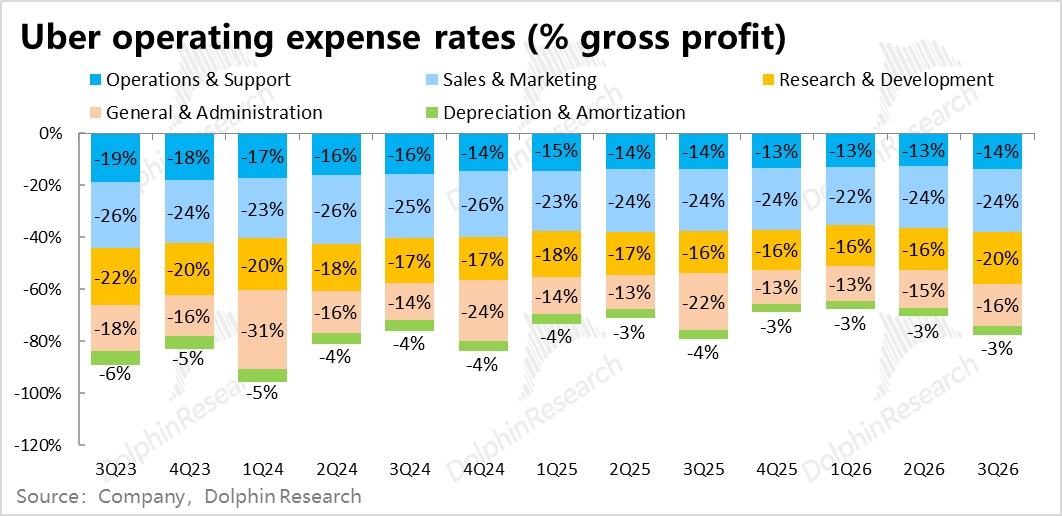
Margin gains were primarily expense-driven. Adjusted operating expenses were about $3.45bn, up only ~11% YoY and down roughly 0.5pt as a percent of GBV, after excluding one-time items this quarter.
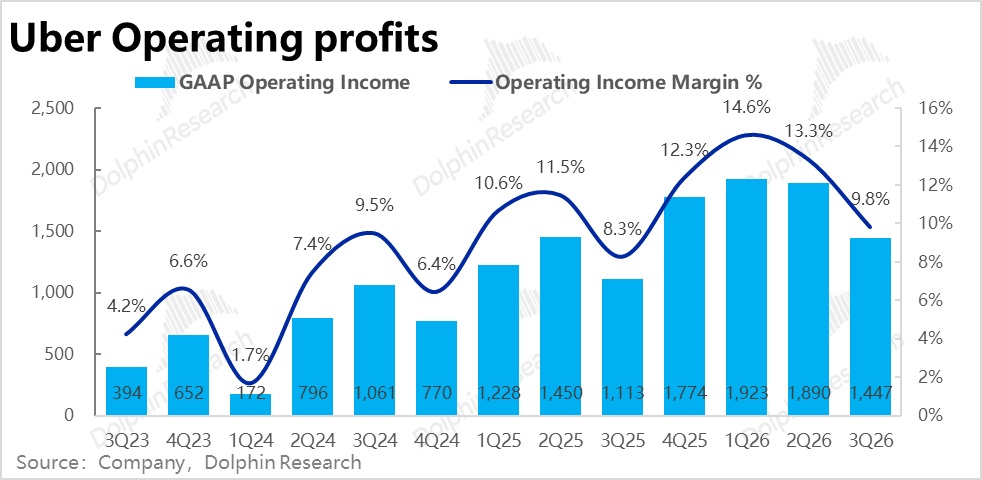
GAAP OP was $1.45bn, which looks about one-third below Street at first glance due to about $860mn of one-offs. These included $480mn for legal and regulatory accruals, $190mn for restructuring, and $55mn related to M&A. Excluding those, profit modestly beat.
FCF was about $2.5bn in the quarter. Share buybacks were only $750mn, about half of last year’s level, as cash was prioritized for M&A.
7) Key metrics snapshot; see call Trans here链接
Dolphin Research view:
1) This quarter: growth slowing, margins providing the floor
The issue lies in growth, especially rides: orders and MAUs have been slowing, and Q4 guidance does not signal re-acceleration. While management attributes rides weakness primarily to driver shortages in Intl markets, this inevitably heightens investor concern about Robotaxi competition.
On the positive side, delivery growth is solid, with strong organic grocery growth and contributions from M&A providing a two-engine setup. However, heavier investment weighed on delivery margins, which is a blemish.
Overall, given valuation pressure from Robotaxi risk, the print is not a clear positive, but it also does not undermine a still-decent fundamental story.
2) Outlook: GBV guide slightly below, profit slightly better but slowing growth
On guidance: Q4 GBV is guided to $63.25bn–$65.25bn. At midpoint, that is about +19% YoY, a further slowdown from Q3 and slightly below Street. Management cited about a 1pt FX headwind and roughly a 1pt drag from Middle East conflict escalation during peak travel season. On a constant FX basis, midpoint growth matches Q3.
By segment, for rides, management is ramping targeted driver recruitment and saw supply improvement in Oct globally. They expect Q4 growth to be in line with Q3, while maintaining a barbell approach on product with both value and premium offerings.
Management also noted that increased driver incentives in Q4 will lower rides monetization, but should have limited impact on margins.
Elsewhere, delivery momentum continues with further investment. Freight GBV growth is expected to be broadly similar to Q3.
Profit: Adj. EBITDA is guided to $3.13bn–$3.23bn, about 1% above Street at midpoint. Margin as a percent of GBV is seen flat vs. Q3, while YoY growth slows from 31% in Q3 to about 28%. Management aims to expand company-wide margins YoY, acknowledging quarterly variability from seasonal supply investments.
Beyond the print, Dolphin Research remains focused on two issues: how far Robotaxi has progressed, and the scope and impact of ongoing delivery M&A.
3) Robotaxi: where are Waymo and Tesla in the U.S.?
The stock has been under pressure, hitting near 52-week lows before earnings, driven by fears around Tesla’s Cybercab and Waymo competition.
a. Waymo: scaling faster, but year-end targets may slip
Waymo operates in 15 major U.S. cities with a reported fleet of ~4,000 vehicles and over 500k paid rides per week as of Sep. Reports suggest the fleet could reach ~8,000 by year-end and ~20k by end-2027.
Waymo is shifting from being a platform partner to primarily operating its own service. It notified Uber that it will launch its own app in Austin and Atlanta in Jan 2028, and most new cities will be self-operated.
b. Tesla: charging fares, but still small scale
Tesla’s fully driverless service is currently only in Austin, with Cybercab charging riders since Sep and entering Dallas in Nov. In the Bay Area it still uses safety drivers.
According to Robotaxi Tracker, as of end-Aug Tesla had deployed roughly 750–900 vehicles in total, including inactive cars. Only about 75 were actually in service.
c. Uber’s autonomous fleet is about one-sixth of Waymo’s
Fully driverless cars on Uber’s platform are expected to be about 700 by year-end, rising to over 2,000 by end-2027, split roughly half U.S., half Intl. That implies U.S. Robotaxi supply will be dominated by Waymo in 2027.
d. How big is autonomous ride volume?
At the market level, Robotaxi remains small. Sell-side estimates put Waymo at ~33–44mn rides in 2026, about 1%–1.5% of the U.S. ride-hailing market. Cybercab remains negligible. Uber management said on the Q2 call that autonomous rides on its platform were under 0.5%.
But erosion is meaningful in Waymo’s core cities. Third-party data show that in Jun, Waymo’s GMV share was ~15% in San Francisco and Los Angeles and ~16% in Phoenix, measured within its service zones.
Management also noted that in mature autonomous markets, the rides TAM grew 7pt faster than the rest of the U.S. over recent quarters, suggesting Robotaxi is expanding overall demand.
e. Dolphin Research’s take
The bottleneck is shifting from tech to fleet size and capital, making expansion a function of vehicles and funding. Reports indicate Waymo has raised about $16bn in equity this year and announced a $5bn term loan in Oct.
Leverage-financing a larger fleet signals confidence in commercial viability and a push to scale. 2027 is likely to be Waymo’s scale-up year, and Uber’s rides growth could first feel pressure in Waymo’s core cities.
4) Delivery M&A: what is being bought, and how does it affect the story and valuation?
a. Latest moves
With Robotaxi posing a major potential shock to rides, the company’s clear strategy has been to acquire delivery assets, tilting the biz. mix further toward delivery to mitigate rides-driven valuation risk. Key deals include the following.
Delivery Hero: an all-cash offer of €41.5 per share in Jul, valuing 100% at about $14.8bn (about $13.7bn net of current stake), acquiring 50 of 64 markets with the remaining 14 lossmaking markets sold to SSW.
ezCater: a $2.3bn cash deal in Oct for a U.S. corporate catering platform with over $2.5bn in GMV over the past 12 months. Closing is expected in the coming months.
b. Implications for the investment case
First, the biggest value of these moves is reducing rides’ share in the group, hedging Robotaxi risk that the market cannot fully price. With Delivery Hero consolidated, delivery would be about 56% of total GBV, though profit contribution will rise more slowly given lower margins.
Second, delivery is not Uber’s strongest arena. Uber is the undisputed No.1 in rides, but in U.S. delivery its execution and competitiveness lag DoorDash, so shifting focus could intensify competition.
Third, assets available to buy are not top-tier. Delivery Hero’s growth and margins are below Uber Eats, and Getir reportedly failed in its 2024 push into Western markets, with Uber buying its Turkey food biz after a sharp valuation drop.
Fourth, DoorDash is also bidding for assets. Instacart is a prime example: both Uber and DoorDash reportedly explored a deal, and DoorDash announced an acquisition in late Oct, which will make its online grocery scale far exceed Uber’s in the U.S. Management downplayed the impact, noting merchants prefer multi-channel partnerships.
Fifth, M&A diverts cash away from shareholder returns. Encouragingly, management now indicates no new M&A outside autonomy at least through 2027, with a focus on organic growth, autonomy, and opportunistic buybacks next year. More cash will go to shareholders.
c. Valuation impact
Dolphin Research believes the primary valuation discount stems from Robotaxi, which delivery M&A cannot remove. Over time, if synergies materialize and delivery’s share rises, a diversified platform narrative could lend support. In the near term, the market cares more about when buybacks resume and whether M&A continues.
5) Valuation: not expensive, but limited margin of safety
On the company’s current non-GAAP OP basis, Dolphin Research estimates ~$10.9bn in 2027, up ~22% YoY and broadly aligned with pre-earnings consensus. Applying the guided non-GAAP tax rate of ~23% yields about $8.4bn after tax.
At an intraday price of ~$71.7 on Nov 4, market cap was about $147bn, implying ~17.5x 2027 after-tax profit. With profit still growing over 20%, the valuation is not high.
On a conservative SOTP, we carry forward prior framework: Rides valued on 2031 steady-state net profit after full autonomy impact, applying 15x PE and discounting back to 2026, at about $51.4bn. Delivery valued on updated 2027 adj. OP, taxed at about 23% to ~$3.9bn, applying 18x PE, at about $70.2bn.
The total is about $121bn, or roughly $59 per share, about 18% below spot. Given uncertainty around the rides market structure and incomplete pricing of disruption risk, the setup is not especially safe. A broad non-AI rally tied to the U.S. election also thins the cushion.
Risk disclosure and statement:Dolphin Research disclaimer and general disclosure
Prior Uber coverage by Dolphin Research:
Aug 6, 2026 earnings take: Uber: Robotaxi headache, pivoting hard into delivery?
Aug 5, 2026 call Trans: Uber (Trans): $10bn bet on AV, buybacks yield to M&A for now
May 7, 2026 earnings take: Uber: results intact, but Robotaxi overhang persists
May 7, 2026 call Trans: Uber (Trans): building the AI-era super entry point
Feb 5, 2026 earnings take: Uber: sell-off despite good results, will Tesla upend the house?
Feb 5, 2026 call Trans: Uber (Trans): why a 3P model could win Robotaxi
Nov 5, 2025 earnings take: Uber: results fine, spooked again by Robotaxi?
Nov 5, 2025 call Trans: Uber (Trans): intentionally moderating margin expansion, AV profits far off
Coverage:
Nov 21, 2022: Post-pandemic pains and gains: where does Uber go from here?
Oct 14, 2022: Through COVID and inflation: the ace up Uber’s sleeve
Recommended Articles







Comments (0)
Click the $ button, enter the symbol, and select to link a stock, ETF, or other ticker.