


The Stock Market Just Got Its Worst Inflation News in 3 Years. Here's What History Says Investors Should Do Now.



Key Points
According to the Bureau of Labor Statistics, inflation hit 4.2% in May.
That's the highest it's been since April 2023.
Higher energy prices are the prime culprit, but smart investors should stay the course.
We just got a sobering wake-up call about inflation from the Bureau of Labor Statistics.
It's bad enough that the marquee number -- May's year-over-year inflation rate -- jumped to 4.2%, a three-year high, but it's also the third straight month-over-month increase of 0.5% or more. The S&P 500 (SNPINDEX: ^GSPC) dipped 1.6% on the news.
Missed Nvidia in 2009? This Rare Signal Is Flashing Again. In 2009, a "Double Down" signal flashed for a little-known chipmaker called Nvidia. For the first time in years, that same "Total Conviction" signal is flashing for a company 1/100th the size of Nvidia. Continue »
Here's what's going on and what history tells investors to do now.

Image source: Getty Images.
Inflation just keeps going up
Annual inflation, according to the Consumer Price Index (CPI), stood at just 2.4% in January and February, meaning the average item that cost $100 in February 2025 cost $102.40 in February 2026.
That probably doesn't sound like much of an increase. Indeed, the Federal Reserve's target for annual inflation is 2%, so January's and February's numbers were above the target, but not by much.
That changed after the U.S. launched its war on Iran on the last day of February. Iran's response, closing the Strait of Hormuz to maritime traffic, forced tankers carrying Middle Eastern oil to sit idle and drove the global cost of fuel skyward. U.S. Inflation in March was 0.9% higher than in February, and annual inflation rose to 3.3%.
In April, monthly inflation climbed 0.6%, taking annual inflation to 3.8%, while the recently released May figures show it at 4.2% for the first time since April 2023.
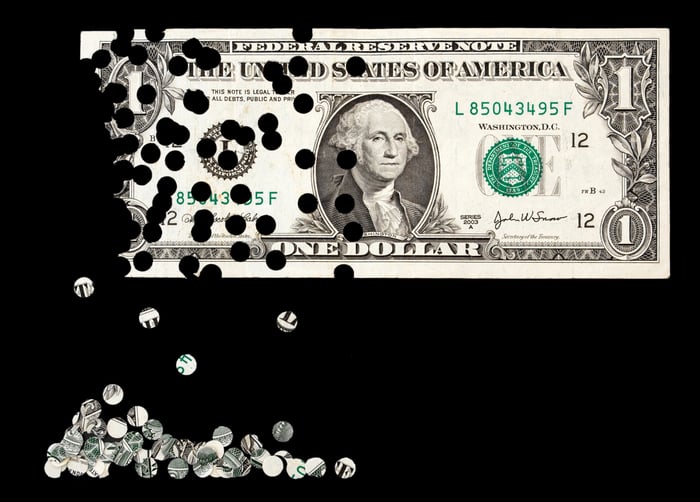
Image source: Getty Images.
What 4.2% annual inflation means is that our $100 item from May 2025 would cost $104.20 in May 2026. That isn't much more expensive than $102.40. The bigger problem is that inflation compounds, so we also need to consider that the May 2025 item was 2.4% more expensive than in May 2024, when it was 3.2% more expensive than in May 2023, when it was 4.1% more expensive than in May 2022, when it was (yikes!) 8.5% more expensive than in May 2021.
So over five years, the item that cost $100 in May 2021 now costs $124.40, 24.4% more. That's definitely higher than in recent decades. Inflation stayed below the Fed's 2% target for much of the 2010s and below 3% for most of the 2000s.
What can you do?
Most of the current inflation is caused by soaring energy prices, especially gasoline (up 40.5% year over year) and fuel oil (up 58.9%). Stripping out food (up 3.1%) and energy, the CPI rose only 2.9% in May, but that's cold comfort to consumers and businesses watching their fuel costs rise by double-digit percentages.
If the Iran war ends for good with an agreement to keep the Strait of Hormuz open and free of tolls, energy prices should recede, and overall inflation should fall as a result. But although a resolution is looking more likely than it did in the spring, it's still far from a done deal.
The most important thing history tells us to do, though, is to grit our teeth and wait. Selling stocks now -- especially when inflation may be about to get lower -- would be a textbook example of trying to time the market. History has shown that investors who wait out periods of geopolitical uncertainty almost always end up better off than those who don't.
Where to invest $1,000 right now
When our analyst team has a stock tip, it can pay to listen. After all, Stock Advisor’s total average return is 897%* — a market-crushing outperformance compared to 208% for the S&P 500.
They just revealed what they believe are the 10 best stocks for investors to buy right now, available when you join Stock Advisor.
*Stock Advisor returns as of June 25, 2026.
John Bromels has no position in any of the stocks mentioned. The Motley Fool has no position in any of the stocks mentioned. The Motley Fool has a disclosure policy.
Recommended Articles







Comments (0)
Click the $ button, enter the symbol, and select to link a stock, ETF, or other ticker.