


Sungrow: Revenue Cold Snap, Margins Brighten?



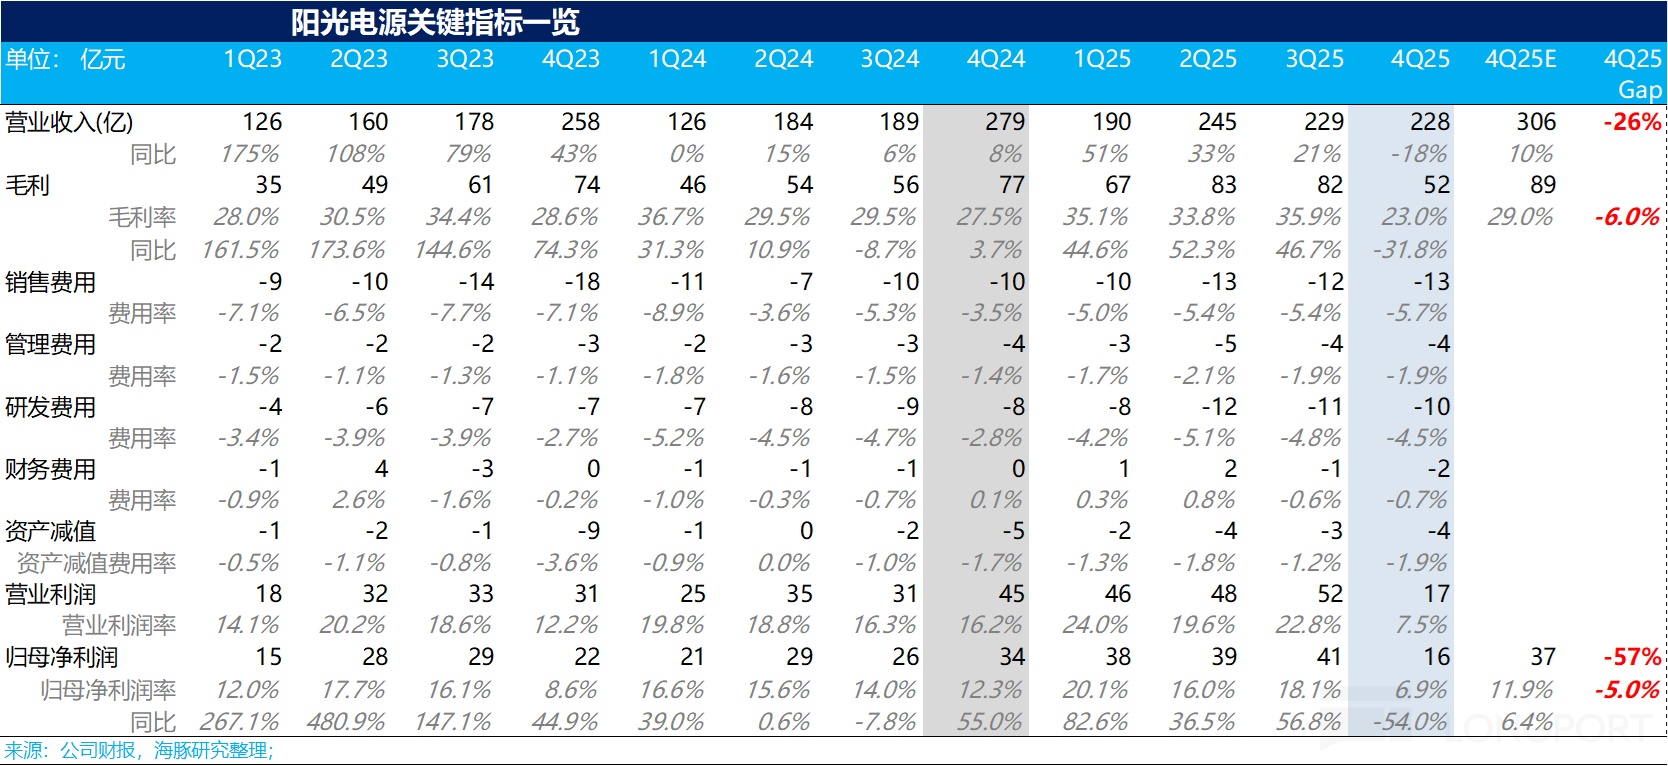
On the evening of Apr 28, 2026, Sungrow Power Supply (300274.SZ) released its Q1 2026 results. In short, revenue and profit declined, but GPM started to recover from a trough:
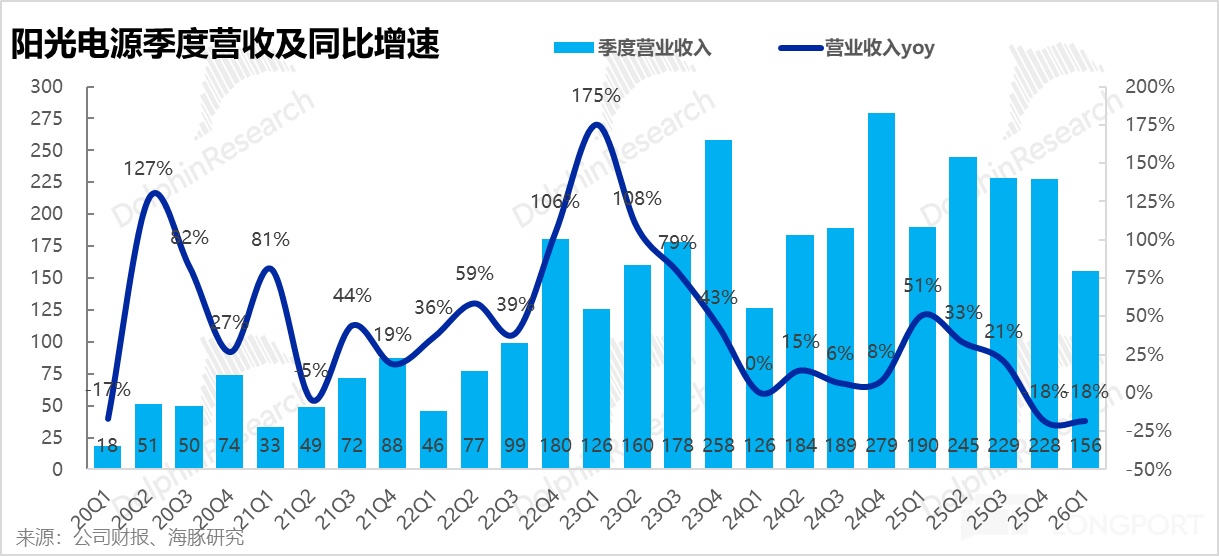
1) Revenue missed again, posting another YoY decline:$Sungrow Power Supply(300274.SZ) reported total revenue of RMB 15.6 bn in Q1, down 18% YoY (vs. market est. RMB 21.2 bn). The miss was driven by lower ASPs in energy storage systems (ESS), soft domestic demand for PV inverters, and a deliberate pullback in project development.
By business line:
① ESS: volume and price under pressure, with a structural shift to overseas accelerating: Q1 ESS revenue was RMB 8.7 bn, still down YoY, mainly due to declining system ASPs. Shipments: ESS deliveries were 11.4 GWh in Q1 2026 (down ~5% YoY), with the decline largely due to a high base from a Saudi project last year (c. 4 GWh). Management kept the full-year shipment target unchanged at 60 GWh, with Europe’s share rising sharply, the Middle East declining, and the Americas and China roughly flat vs. last year.
ASPs: Q1 ESS ASP was RMB 0.76/Wh, still down YoY, primarily because a) in Q1 last year, a Middle East project recognized ~RMB 4 bn of revenue at ASP of ~RMB 1.00/Wh, with no comparable high-margin project this year; b) competition intensified materially across ESS: prior 40%+ GPM attracted new entrants, pushing down signing prices in Europe and LatAm vs. last year, which in turn pressured ASPs and margins. That said, ASP rose 26% QoQ from the Q4 trough of RMB 0.61/Wh. We believe the QoQ rebound was driven by a) better mix, with overseas share rising from 86% to 91% (Europe/Australia, as higher ASP/GPM markets, increased their weight), offsetting part of the price pressure; b) partial pass-through of upstream lithium carbonate price increases to downstream customers.
② PV inverters under broad pressure, with both volume and price down: Q1 inverter revenue was RMB 5.0 bn, down 15% YoY. Shipments: 31 GW in Q1, down 9% YoY, mainly due to a) overseas: tariff policy uncertainty in the U.S. in 1H last year led to industry hesitation and shipment delays, affecting Q1 2026 deliveries and revenue recognition; b) domestic: the 'Doc. 136' and curtailment policies dampened returns, and Sungrow proactively scaled back lower-margin residential products.
③ New energy project development fell sharply, entering a ‘dormancy’ phase amid policy noise: The 'Doc. 136' impact impaired long-term IRR expectations for PV plants, directly weakening downstream investment starts. Q1 revenue from project development and other businesses was only RMB 1.86 bn, down 30%+ YoY (down 72% QoQ). As this is a low-margin segment, the lower mix share actually improved the overall profit structure.
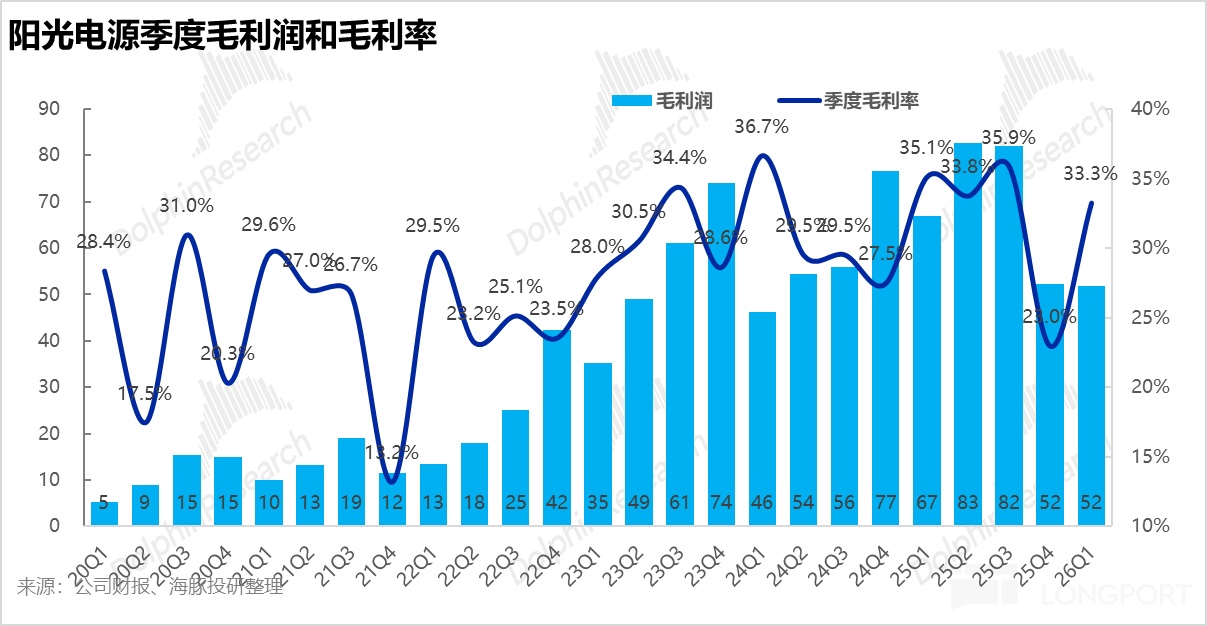
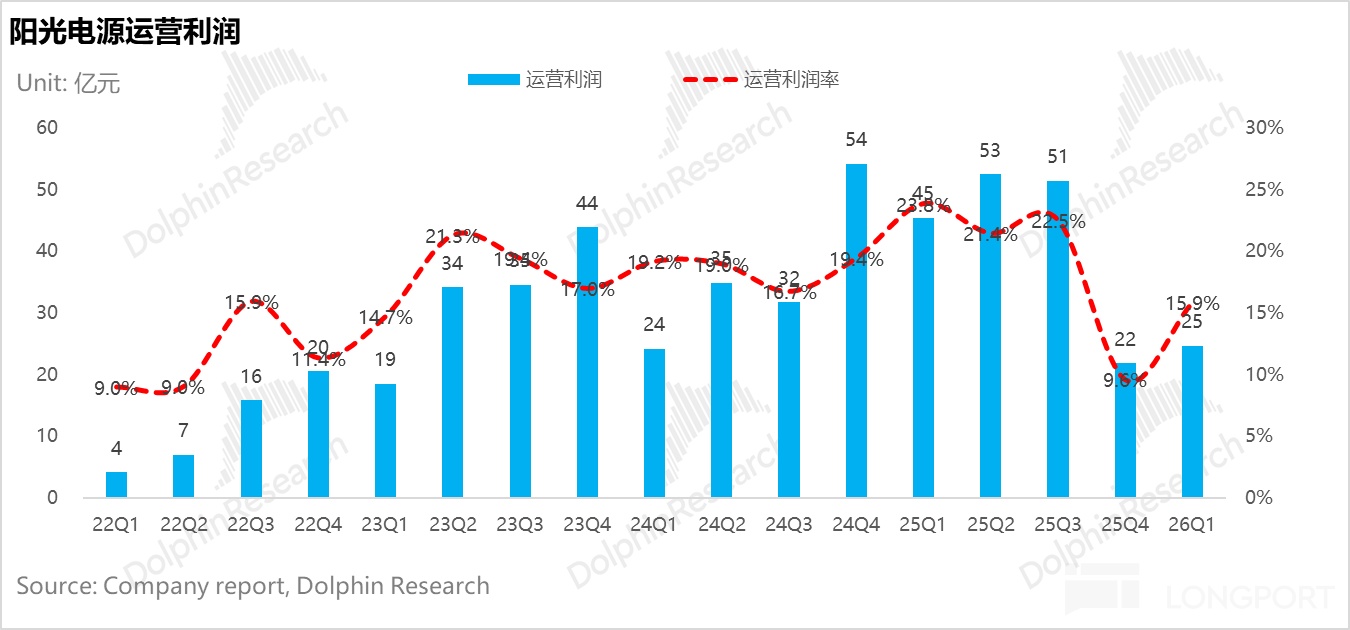
2) GPM emerging from the trough, rebounding QoQ from last quarter’s record low: Q1 gross profit was RMB 5.2 bn, down 22.6% YoY, reflecting weaker-than-expected revenue. Blended GPM reached 33.3%, rebounding 1,030 bps QoQ from the record low of 23%. The QoQ recovery was driven by the lower mix of low-margin project development, ESS margin improvement, and higher inverter GPM as Sungrow exited low-margin residential.
By segment:
① ESS GPM finally improved QoQ: Q1 2026 ESS GPM was 30%, still below nearly 40% in 1H 2025, but up 600 bps QoQ from 24% in Q4. We believe the key drivers were: a) Mix optimization: overseas revenue share kept rising, with greater ESS contributions from Europe and Australia, lifting overall margins as high-margin regions gained weight.
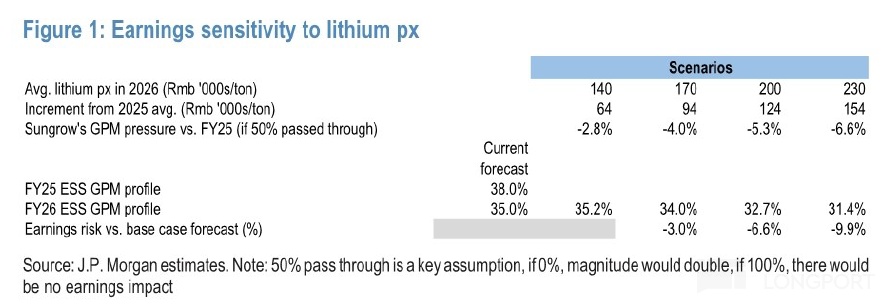
b) Price pass-through: despite lithium carbonate rebounding from RMB 100k/ton at end-2025 to RMB 180k/ton, the company has begun to implement pricing rules of 'full pass-through for new orders, ~50% pass-through for backlog', reversing the prior losses from closed contracts and alleviating market pessimism. GPM is likely to see further improvement in 2H.
② Inverter GPM also improved QoQ: Q1 inverter GPM was around 40%, up 200–300 bps YoY, mainly due to a) rising overseas mix: domestic demand fell after 'Doc. 136', and Sungrow reduced low-margin residential exposure, which supported blended GPM; b) better delivery quality lowered after-sales costs, jointly pushing margins higher.
③ Mix optimization: The sharp drop in low-margin project development revenue share provided a floor for overall GPM. In Q1 2026, this segment’s GPM was roughly in line with 1Q25.
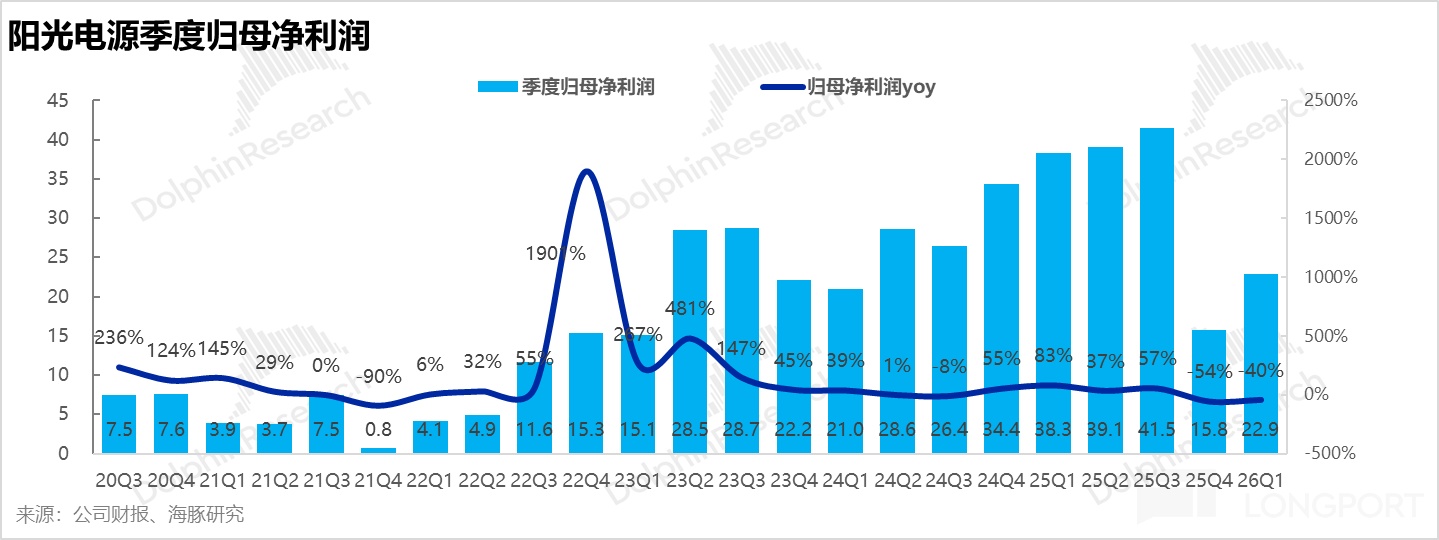
3) Profit: hit by both a high base and FX losses: Attributable NP fell 40% YoY to RMB 2.3 bn, down nearly RMB 1.5 bn YoY, mainly due to a) a high base from a Saudi project last year that contributed ~RMB 1.0 bn of profit (c. RMB 0.25/W); b) larger FX losses as the EUR and USD weakened this year, adding over RMB 400 mn YoY in losses.
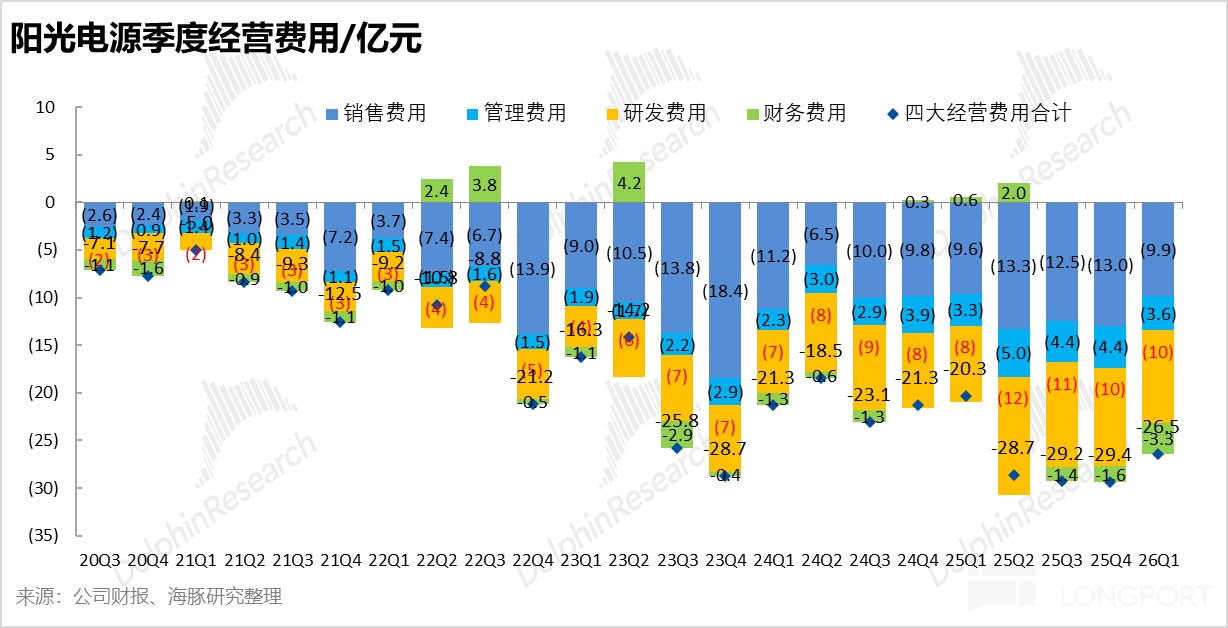
Excluding the RMB 400 mn FX drag, Q1 attributable NP would be ~RMB 2.7 bn, narrowing the YoY decline to ~30%. While macro FX losses are understandable, a 30% drop ex-FX still points to intensified industry competition compressing on-book profits, amid lower ESS ASPs and GPM YoY. On a QoQ basis, profitability is improving from the trough. Q1 NPM was 14.7%, rebounding 780 bps from last quarter’s 6.9% low, driven mainly by a 1,030 bps QoQ increase in GPM to 33.3%, ESS margin recovery off the bottom, and partial downstream pass-through of lithium carbonate price hikes, easing the worst-case fears after last quarter’s results.
Dolphin Research view:
Overall, Q1 2026 still showed revenue and profit declines, but GPM has started to recover from its low. For the main profit and valuation driver, ESS, ASPs and margins are still down YoY, reflecting heavier competitive pressure on reported profits. However, on a marginal basis, ESS GPM is improving QoQ, and the pricing rule of 'full pass-through for new orders and ~50% for backlog' is being implemented, helping to reverse prior losses on closed contracts and the fear that price erosion would fully offset volume gains.
Outlook for 2026:
① ESS: The company maintains its 2026 shipment target at 60+ GWh (+40% YoY). By region, Europe’s share should rise significantly, the Middle East should decline, and the Americas/China should be roughly flat YoY; Europe is a higher-margin region. Coupled with the pricing mechanism noted above, a better mix should partially offset a tougher competitive landscape and mitigate destructive price wars.
Under a base-case scenario, we estimate 2026 ESS shipments of 63.4 GWh (+47% YoY), with ASP down 5% YoY to RMB 0.82/Wh, driving ESS revenue up ~40% YoY. On ESS margins, management still expects a downward long-term trend, mainly because:
a) The market is expanding from four core regions (U.S., Western Europe, Australia, China) to a global footprint. In Europe, demand is extending from the U.K. to Germany and Spain, and further into Eastern Europe (e.g., Poland, Hungary, Romania) in 2026, where price sensitivity is higher and margins lower. Growing volumes in price-sensitive regions such as the Middle East, APAC, and India will also weigh on industry GPM.
b) Higher lithium carbonate prices in 2026 add pressure, and Sungrow cannot fully pass the cost increase to customers, further squeezing ESS margins. c) Competition in ESS has intensified substantially, with rising overseas in-market rivalry. Although ESS has higher barriers than PV (safety, performance guarantees, local compliance, degradation, lifecycle services, and tech innovation), prior 40%+ GPM attracted many new entrants, pushing margins lower over time.
d) Sungrow does not produce cells, so higher upstream lithium and cell prices cap margin headroom. Management previously guided that a 30% GPM is a reasonable long-term target for ESS, contingent on the volume-margin balance. On a base case, we assume ESS GPM at 30%–32% in 2026, down 450–600 bps YoY.
② PV inverters: With weak domestic demand (China’s Q1 PV installations fell ~30% YoY) and tougher competition (Q1 ASP dipped to ~RMB 0.16/W, partly seasonal), we expect inverter shipments to edge down 1.3% YoY to 141 GW. ASP is projected to fall 7% YoY to RMB 0.20/W, taking inverter revenue down ~8.3% YoY. On margins, the company sees a ~35% GPM midpoint, with quarterly fluctuations driven by regional mix (e.g., this quarter’s higher overseas mix lifted GPM to ~40%). We forecast 35% GPM for 2026, roughly flat vs. 2025.
③ Project development revenue: The 'Doc. 136' impact has hurt long-term plant IRRs, directly dampening downstream investment starts. We estimate this segment’s revenue will fall 25% YoY to RMB 12.4 bn in 2026, with GPM down 150 bps YoY to 13%. Overall, we forecast total revenue of RMB 98.2 bn in 2026 (+10% YoY), with blended GPM down 120–230 bps YoY to 29.6%–30.6% (ESS GPM at 30%/32%), implying GP growth of only 2.4%–6% YoY.
We expect attributable NP of RMB 13.6–14.5 bn in 2026 (+1%–8% YoY). Applying 15x PE for 2026 (a premium for market leadership) implies fair value of RMB 204.6–220.0 bn, suggesting 19%–24% downside vs. the current ~RMB 270 bn market cap. While Sungrow is investing in the AIDC biz. (sampling by end-2026, mass deployment in 2027, with co-located storage demand ramping from 2027), the core business still faces competitive pressure and weakening integrator moats. We recommend waiting for valuation to revert to a reasonable range before buying on dips.
Dolphin Research coverage on Sungrow Power Supply (300274.SZ):
Apr 20, 2022 call notes: Sungrow: Inverters + ESS, stable volume, volatile margins (transcript)
Apr 19, 2022 earnings take: Sungrow: Apologies delivered, are lofty expectations being reset?
Nov 16, 2021 – Industry deep dive – Parity on one hand, carbon neutrality on the other: Is PV the hope of new energy?
Feb 7, 2022 – Company deep dive – A tough start for PV, will Sungrow fizzle?
Feb 8, 2022 – Company deep dive – After the sentiment flush, is Sungrow still chasing the sun?
Risk disclosure and statement:Dolphin Research disclaimer and general disclosures
Recommended Articles








Comments (0)
Click the $ button, enter the symbol, and select to link a stock, ETF, or other ticker.