


CATL: The Unassailable TSM of the Energy Age



On the evening of Apr 15, 2026,$CATL(03750.HK) reported Q1 2026 results. Amid concerns over lithium carbonate price spikes and a slowdown in EV growth, CATL delivered a broad-based beat that squarely addressed both worries.
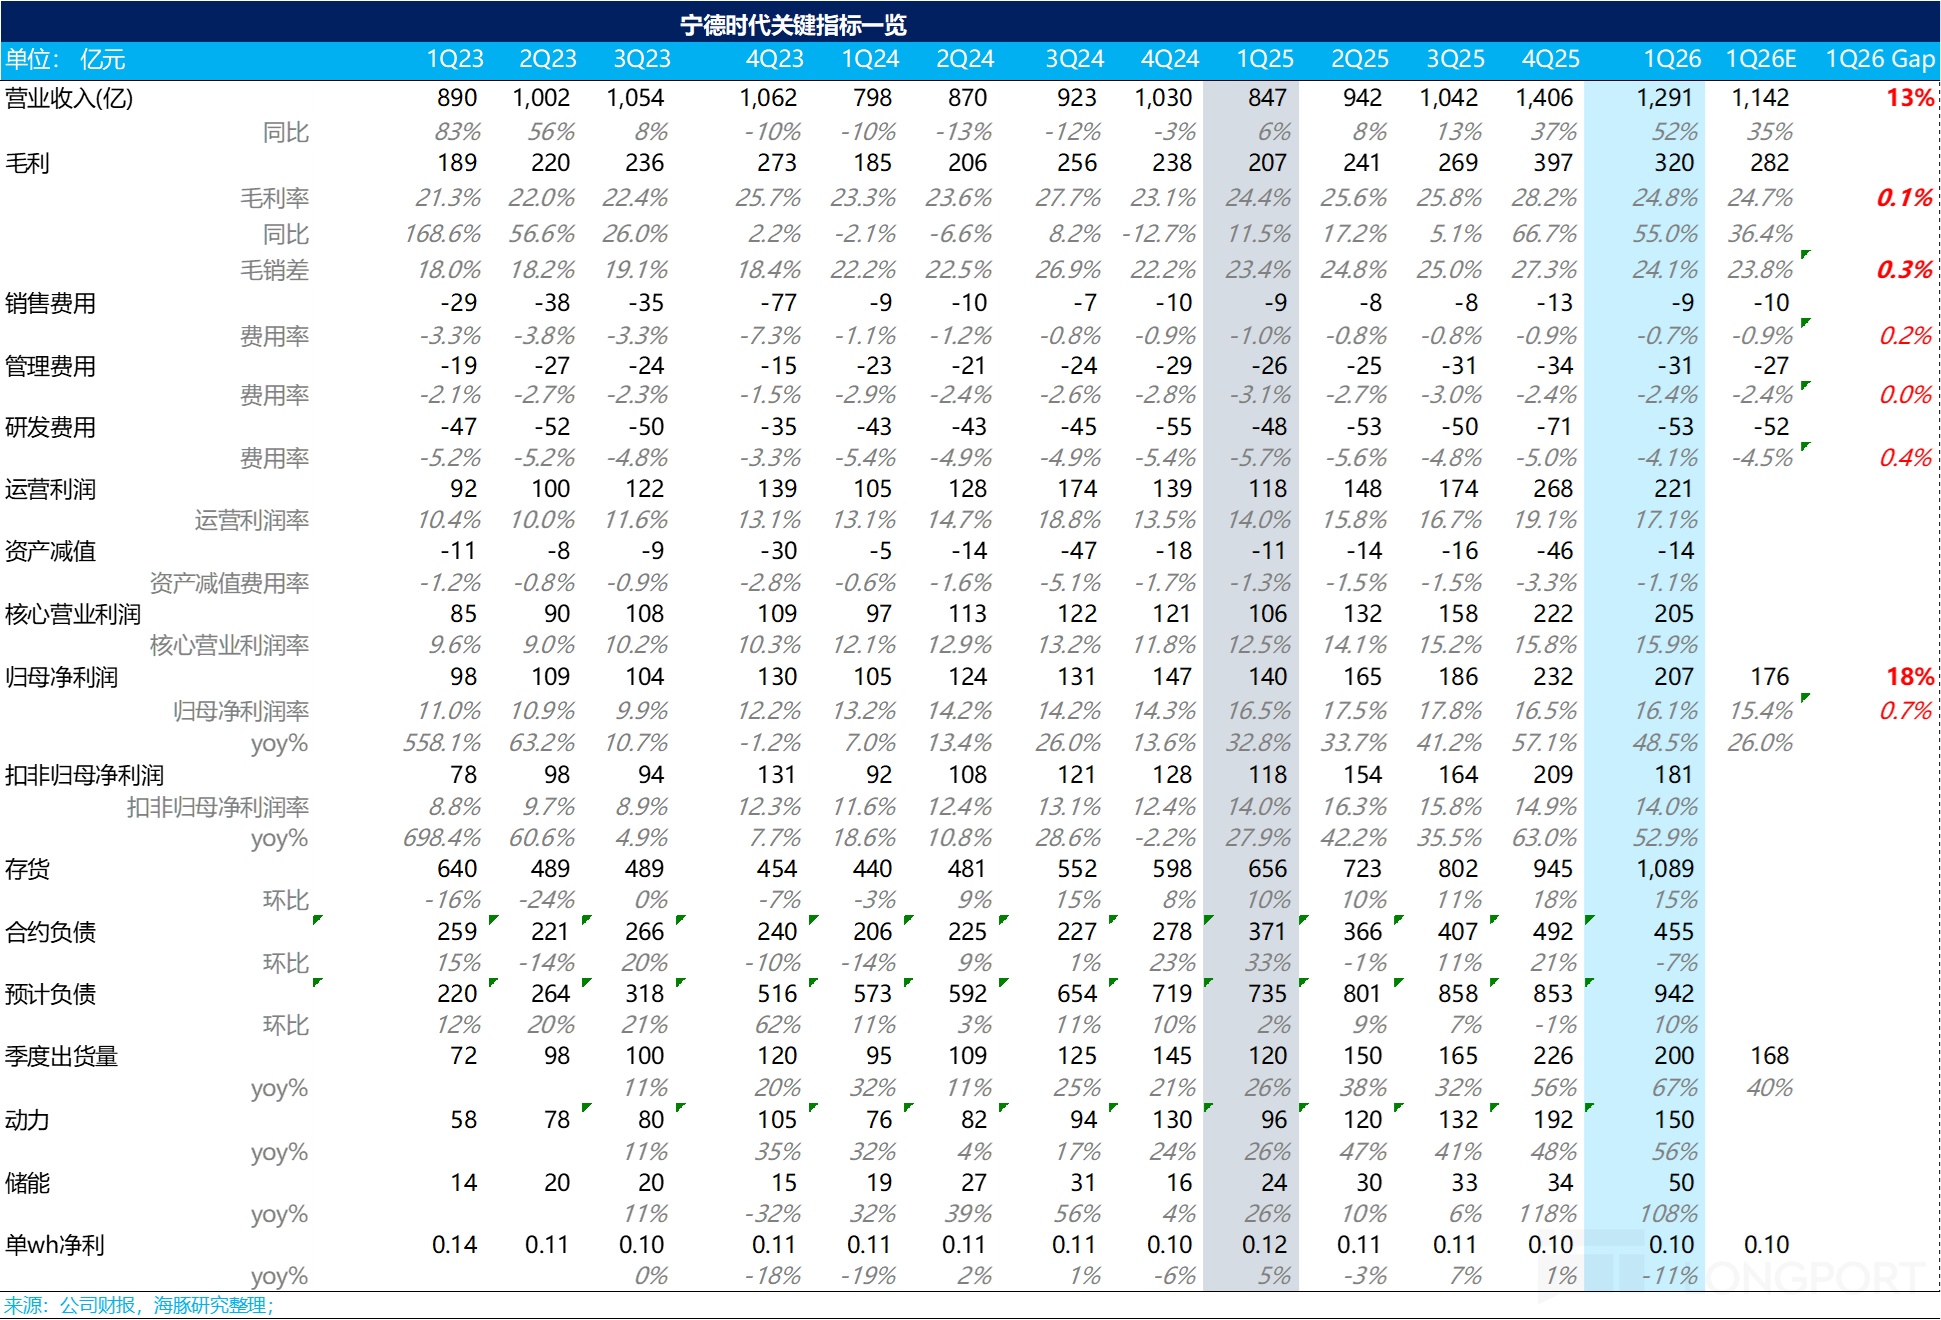
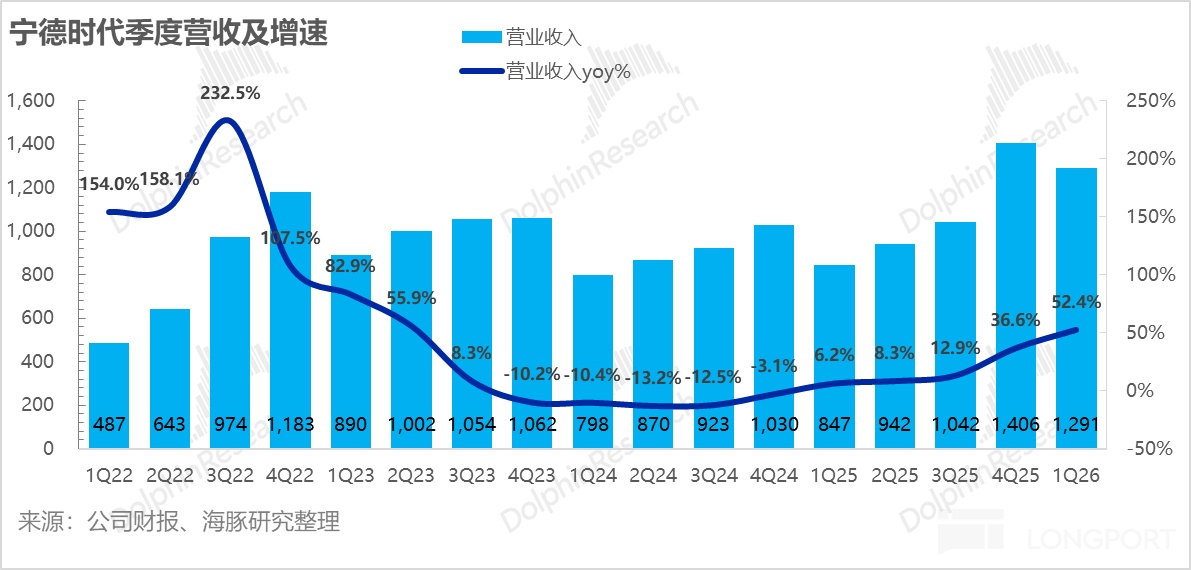
① Revenue beat on both volume and price: Q1 revenue came in at RMB 129.1 bn (+52% YoY), reaffirming the upcycle in lithium batteries and well above the street’s RMB 114.2 bn. The upside was driven by strong shipment growth and effective pass-through of higher upstream raw-material costs, which lifted ASPs.
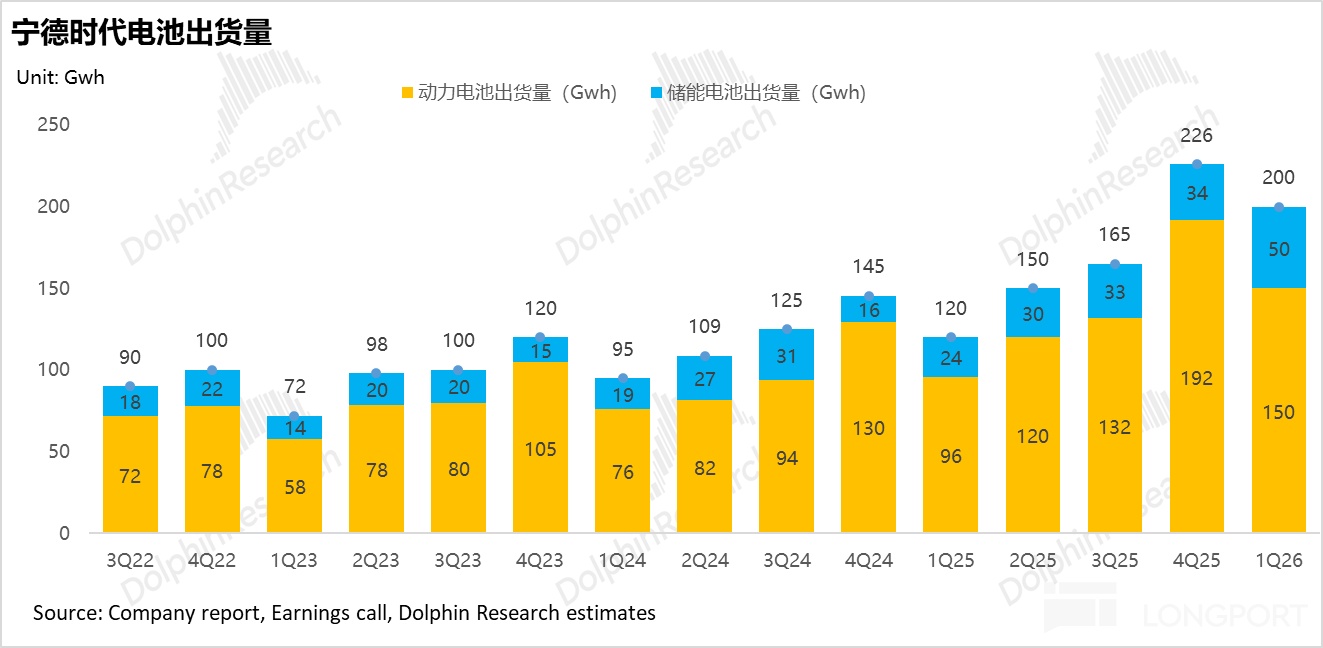
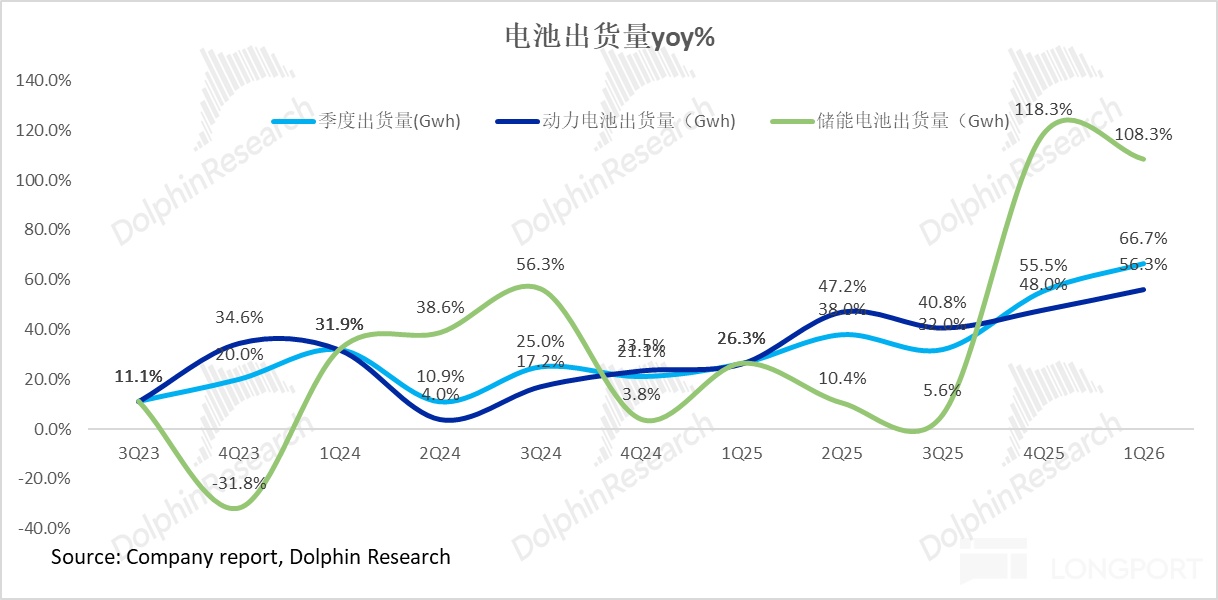
② Shipments surged: Q1 battery shipments exceeded 200 GWh, up ~67% YoY and far above the market’s 168 GWh estimate (+40% YoY). Within that:
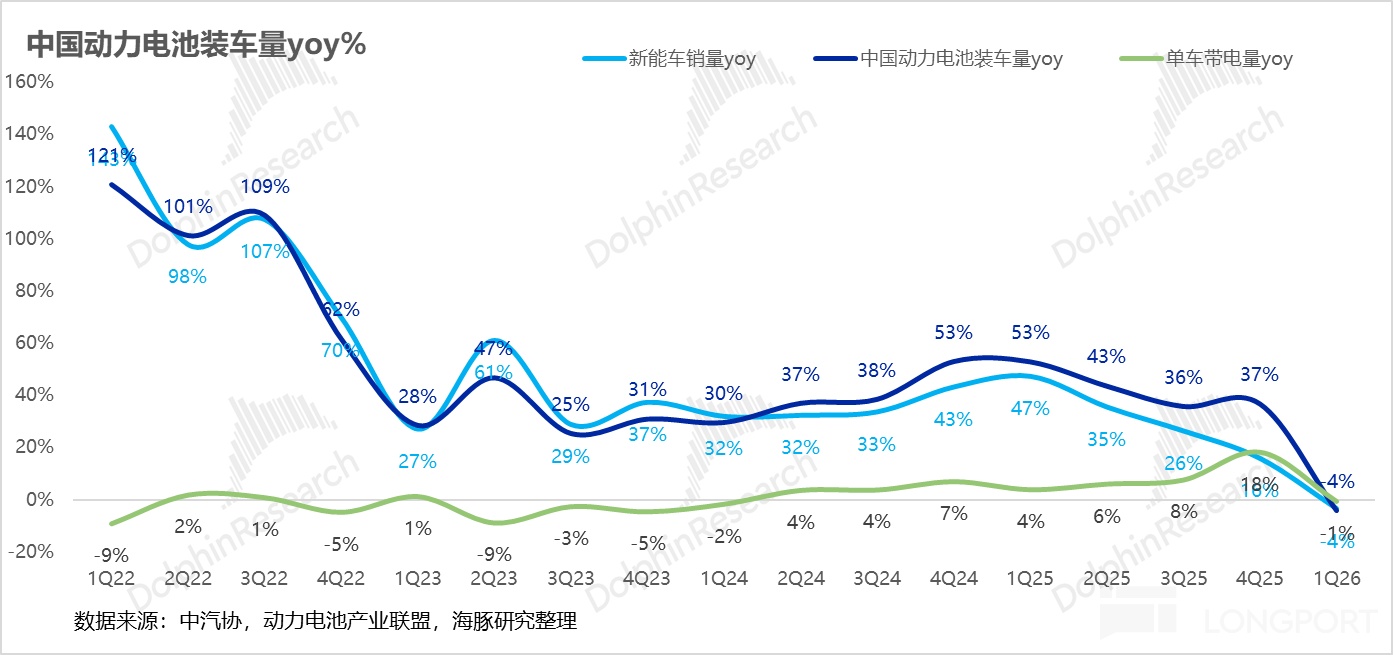
Power batteries led with a leverage effect from higher pack kWh: Power battery shipments were ~150 GWh (+56% YoY), vastly outpacing domestic NEV sales growth (-4%). The core driver is an upgraded industry beta: standard long-range configurations in passenger cars and a rapid rise in high-kWh commercial vehicles created a 1:4 demand leverage that fully materialized.
Energy storage doubled; AIDC emerged as a new growth pole: Storage shipments reached 50 GWh (+108% YoY). Beyond benefits from domestic capacity-tariff policies, AI data centers (AIDC) are generating rigid demand for ESS, and incremental capacity at the Jining base is ramping. Storage has become CATL’s second growth curve.
③ Smooth price pass-through locks in profitability: With lithium carbonate rebounding to RMB 150k–180k/ton, blended ASP rose 4% QoQ to RMB 0.57/Wh. A robust indexation mechanism enabled effective pass-through of cost inflation, dispelling fears of margin erosion from raw-material hikes.
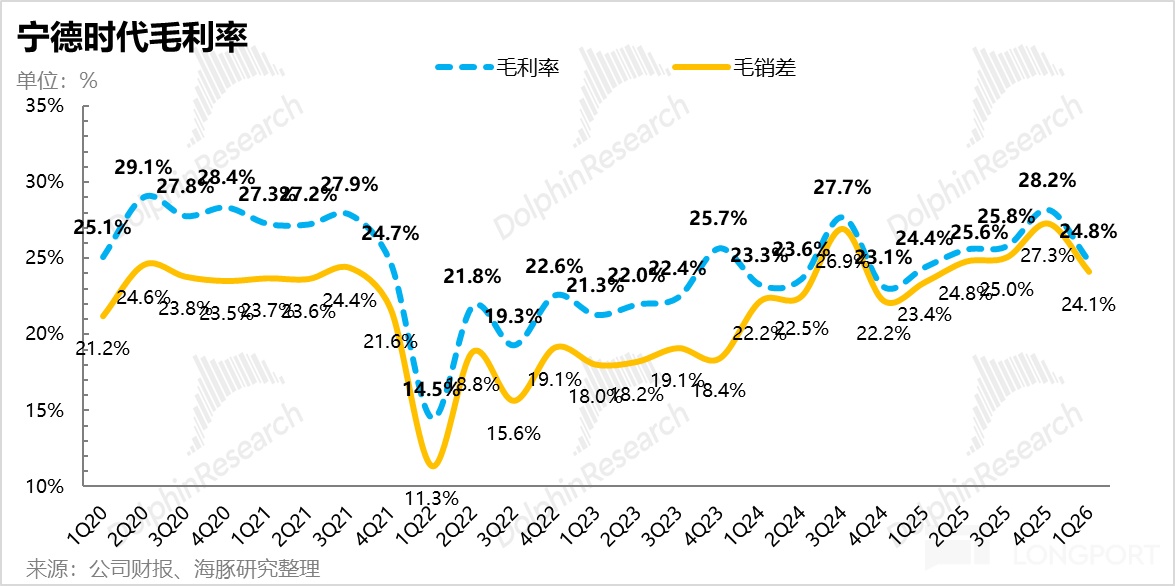
④ GPM eased from highs but remained resilient; cost pass-through cushioned inflation: Q1 GPM was 24.8%, with GP at ~RMB 0.16/Wh. Despite multiple headwinds including lithium price rebound and seasonal utilization dips, CATL’s strong pass-through power and a RMB 94.5 bn low-cost inventory buffer kept profitability solid, underscoring strong cross-cycle defensiveness.
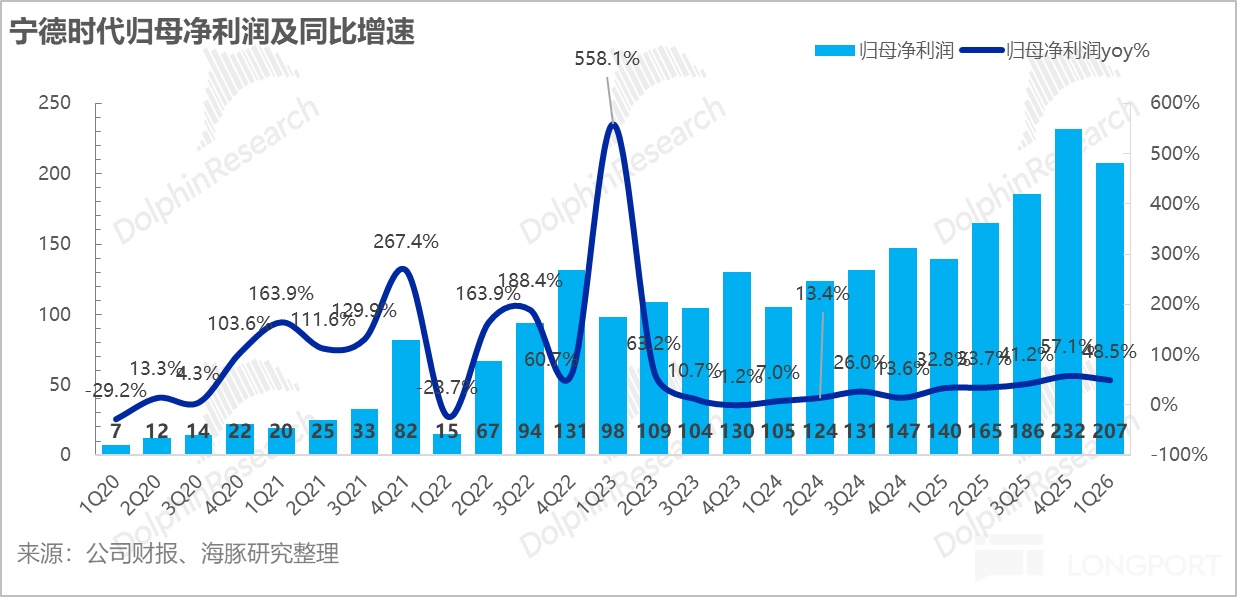
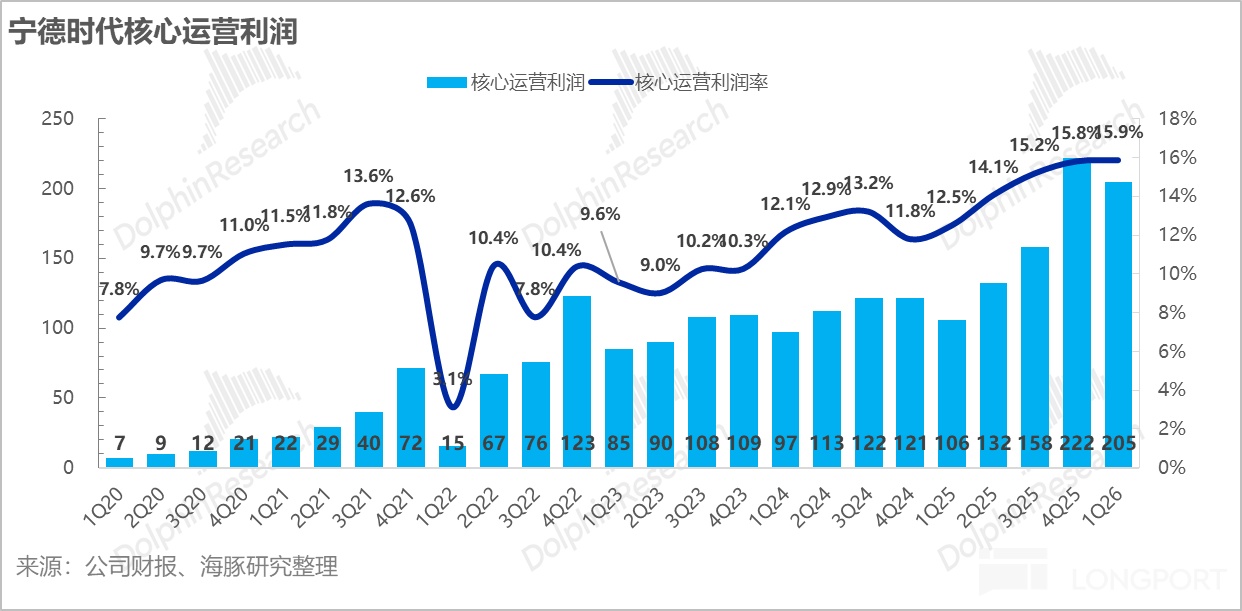
⑤ Net profit beat on impairment relief: Attributable net income was RMB 20.7 bn (+49% YoY), with net profit per Wh steady at ~RMB 0.10. With legacy impairment burdens easing (down RMB 3.2 bn QoQ) and core OPM at 15.9%, CATL not only led in volume but also dispelled concerns that raw-material inflation would erode margins.
Dolphin Research view:
Overall, CATL demonstrated exceptional earnings resilience in Q1. The print was strong in both quantity and quality, with revenue and net profit beating estimates and shipments decoupling positively from the broader industry.
Despite a cocktail of headwinds from upstream price rebounds, seasonality, and policy noise, CATL delivered a double beat. This overturns the bearish thesis that raw-material inflation would eat into margins and echoes Dolphin’s earlier view in ‘CATL: Full-Throttle Capacity, Roaring Back in the AI Infra Era’ that CATL has high earnings visibility and torque in a lithium-battery upcycle, underpinned by cost moats and pricing power.
CATL’s cross-cycle strength is validated across five key metrics:
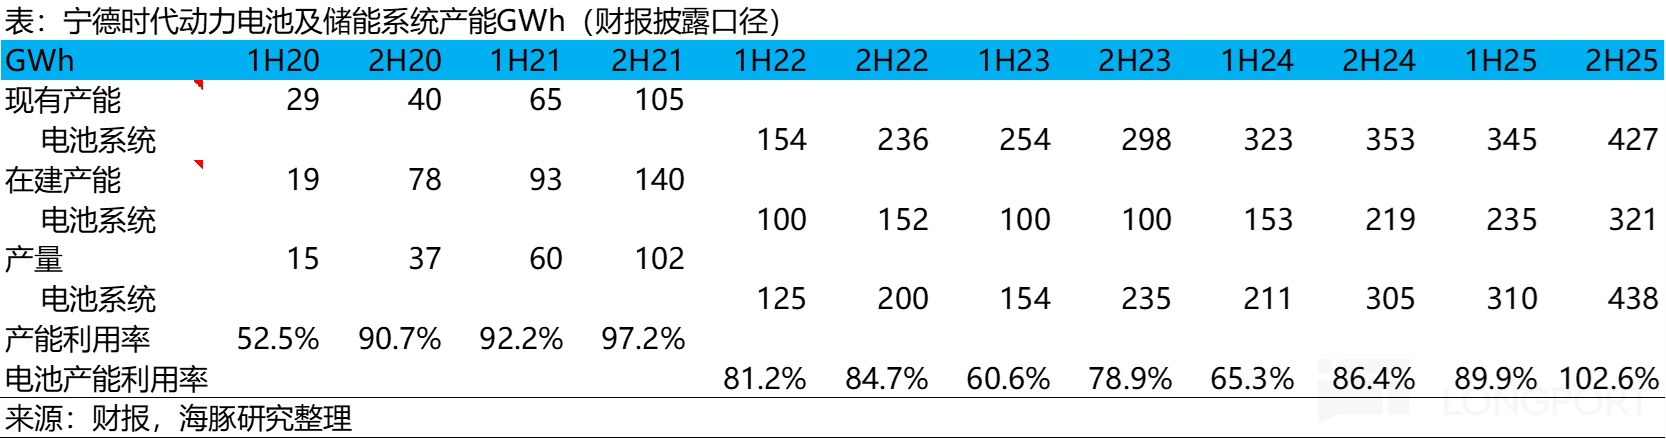
① High utilization through the off-season signals robust demand: Despite seasonal softness and a larger capacity base, utilization stayed at an elevated 85%–90%. With Q2 schedules still guided at 85%–90%, strong production plans ease concerns about demand cooling and EV slowdown dragging shipments.
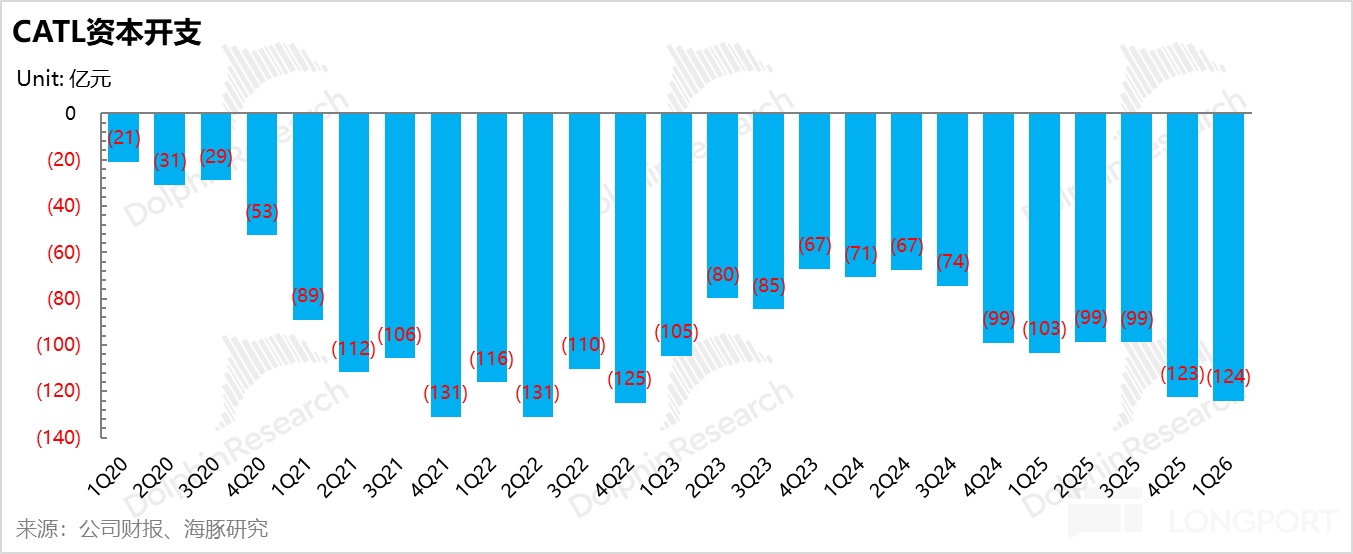
② Capex has re-accelerated, with capacity expansion resuming onshore and offshore: This quarter, capex rebounded to ~RMB 12.4 bn, near the last expansion peak. Against an upgraded 2026 production target of 1.1–1.2 TWh (+42%–55% YoY), CATL is pressing ahead with expansions in domestic storage hubs and high-margin overseas markets across Europe and SE Asia.
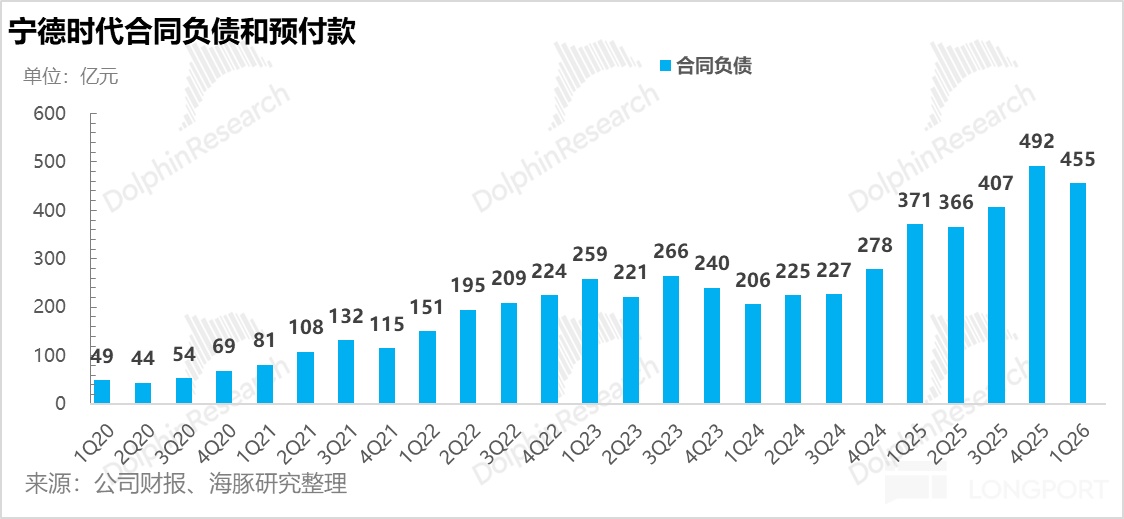
③ Contract liabilities remain elevated, securing baseline visibility: Q1 contract liabilities were RMB 45.5 bn, down slightly QoQ due to faster deliveries converting backlog to revenue. The high level indicates strong order replenishment, ensuring earnings visibility.
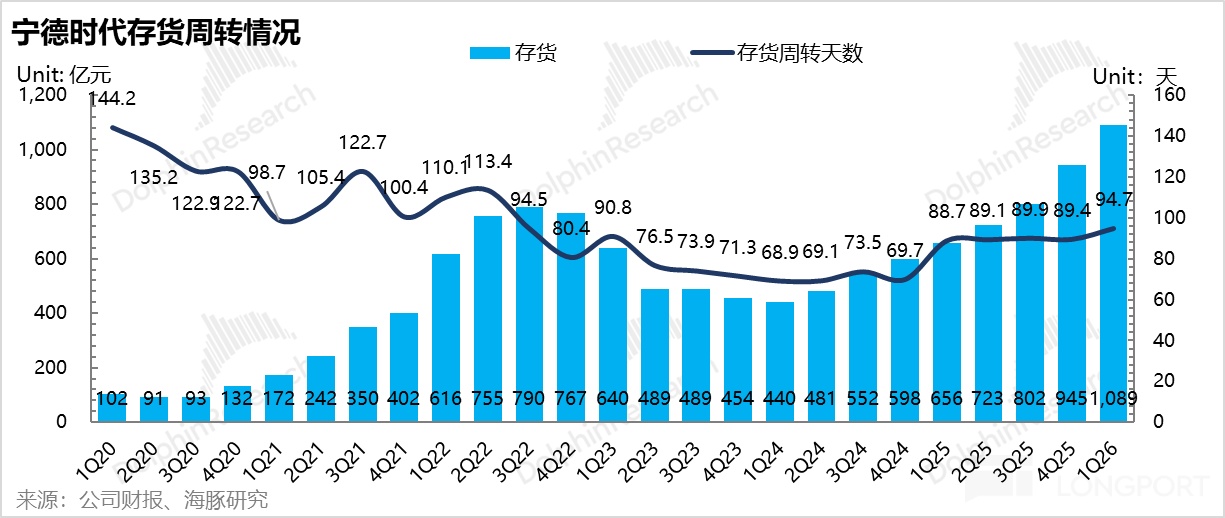
④ Inventory at a record high reflects proactive stocking and goods in transit: The RMB 108.9 bn inventory is not a downcycle overhang but a sign of strong downstream demand. Early low-cost stocking cushioned input inflation, and longer-cycle ESS systems and export logistics increased goods in transit.
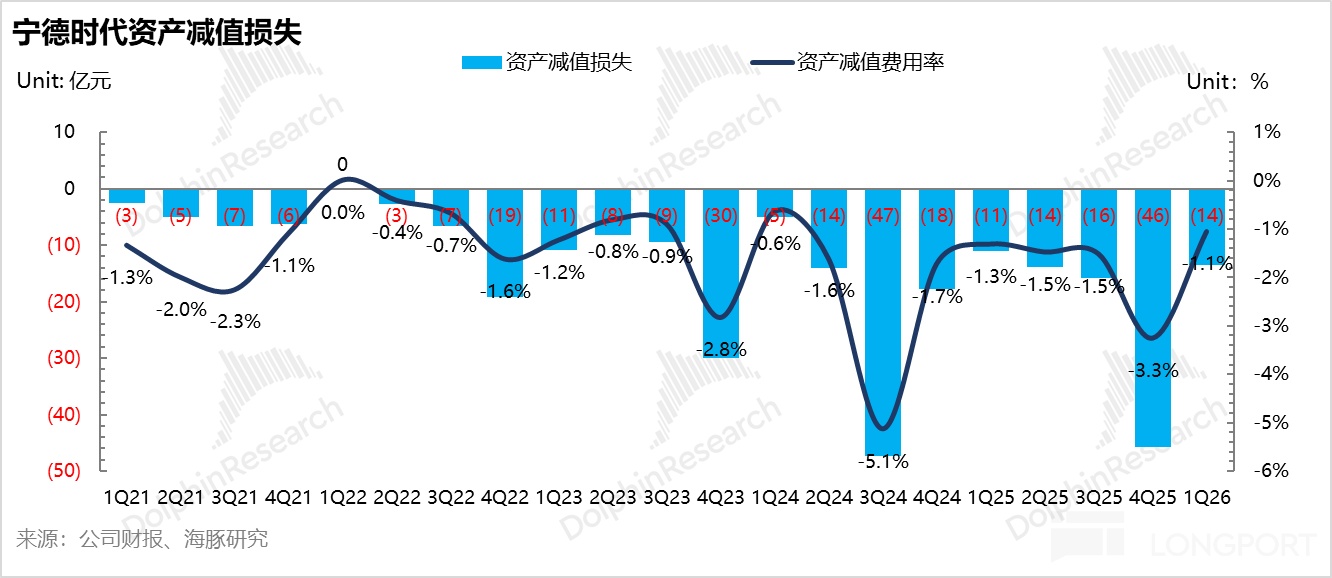
⑤ Impairments cleared, releasing profits: With prior write-downs largely taken and lithium prices stabilizing, Q1 impairment losses fell sharply to just 1.1% of revenue. This allowed scale and ASP gains to flow through to net profit, unlocking earnings elasticity.
Considering renewed capacity expansion, faster overseas ramp (notably Europe), and a booming global ESS market, Dolphin raises 2026 shipment estimates to 950 GWh (+44% YoY). Breakdown and drivers:
Power batteries: 754 GWh (+40% YoY): Gains are supported by share wins from capacity ramp and two powerful beta levers: standard long-range adoption lifting pack kWh per car and higher penetration of heavy-duty/last-mile commercial vehicles with large packs, creating a 1:4 demand effect.
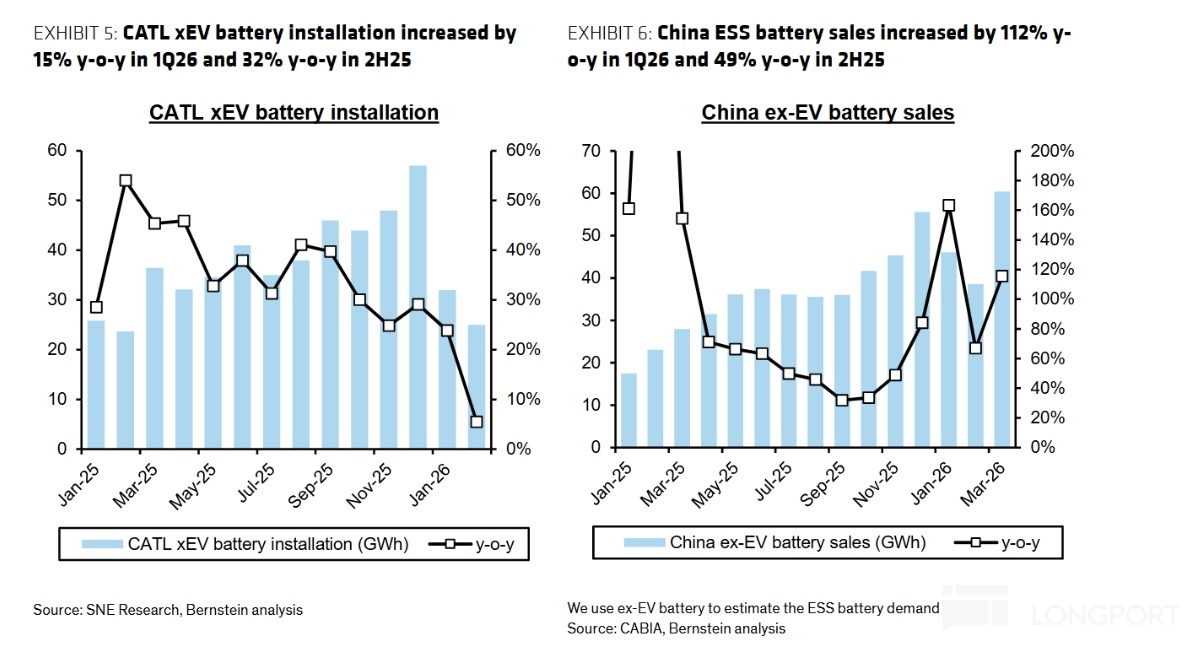
In Q1, power battery shipments were ~150 GWh (+56% YoY), versus domestic NEV unit sales growth of -4%. This sharp ‘scissors spread’ confirms the thesis of higher kWh per vehicle and structural mix uplift.
Energy storage: 196 GWh (+62% YoY): Visibility is strong as domestic capacity-tariff policies cement project economics, and the global AIDC arms race drives massive ESS demand from both grid and user sides.
Even under Q1’s stress test, profitability remained robust. Dolphin assumes full-year net profit per Wh holds at RMB 0.10–0.11, implying FY26 net income of RMB 98.5–104.5 bn on 950 GWh shipments.
Valuation based on the above:
A-shares: Assign 25x PE in an upcycle, implying target market cap of ~RMB 2.46–2.6 tn.
H-shares: Given CATL’s scarcity value as foundational infrastructure for NEV transport and AI computing storage, plus potential A/H liquidity premium, ascribe 30x PE, implying ~RMB 2.96–3.1 tn.
CATL’s fundamentals in the upcycle are strong and stable. But vs. the current H-share market cap of ~RMB 2.86 tn, even at a bullish 30x PE, upside is only ~3%–10%.
Dolphin believes the current stock price and valuation have largely priced in the optimistic case. To break the ceiling, macro demand or shipments must surprise meaningfully to the upside. For investors who missed earlier entries, we recommend close monitoring, avoid chasing, and wait for a pullback in sentiment or macro noise to offer better risk-reward before buying the dip.
Details below:
I. Revenue continues to beat; volume growth and cost pass-through remain the core drivers
Q1 2026 revenue was RMB 129.1 bn (+52% YoY), reaffirming the lithium-battery upcycle and beating the street’s RMB 114.2 bn. Upside came from continued shipment growth and strong pricing power that passed higher raw-material costs downstream, lifting ASPs.
1. Battery shipments: up ~67% YoY to 200+ GWh
Q1 shipments exceeded 200 GWh, up ~67% YoY and well above the market’s 168 GWh estimate (+40% YoY). Specifically:
① Power battery shipments were ~150 GWh (~75% mix, +56% YoY), far above domestic NEV sales growth of -4%, creating a large ‘scissors spread’. Dolphin attributes this to an upgraded industry beta and company alpha working in tandem.
Industry beta: higher kWh per vehicle and leverage from high-kWh commercial vehicles:
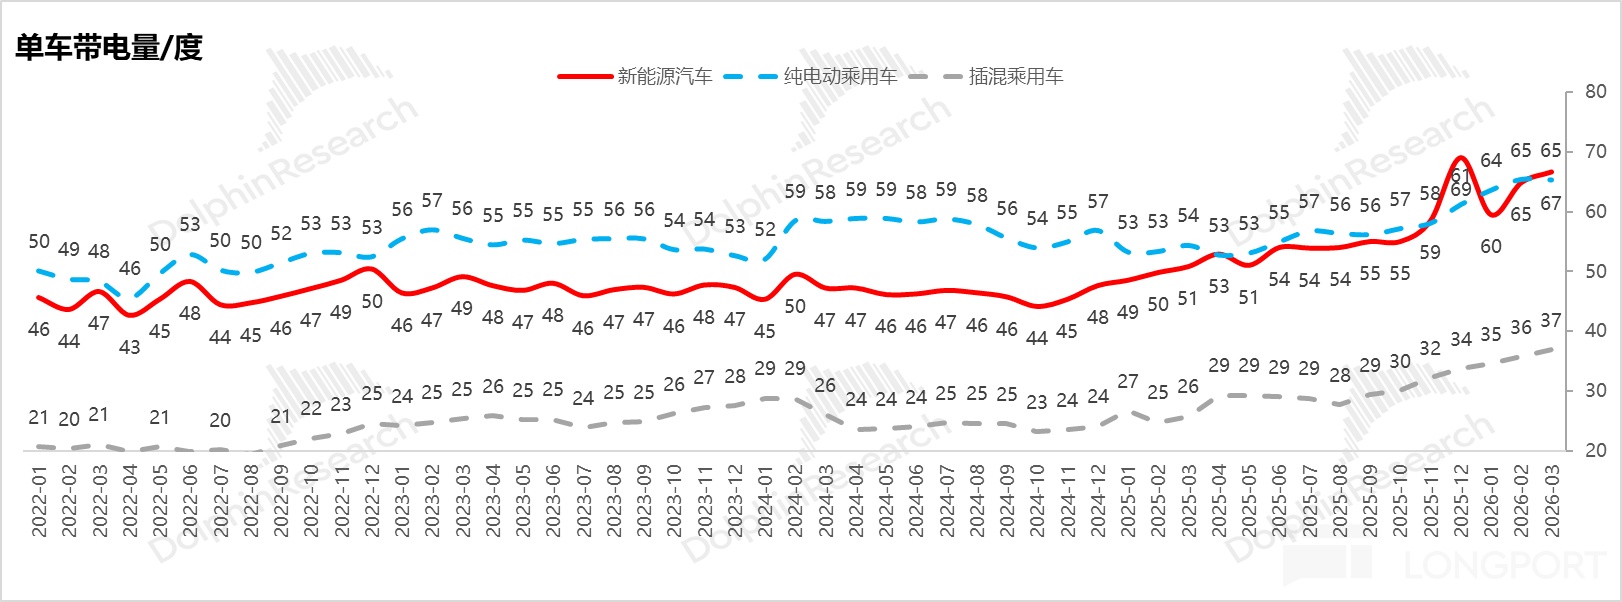
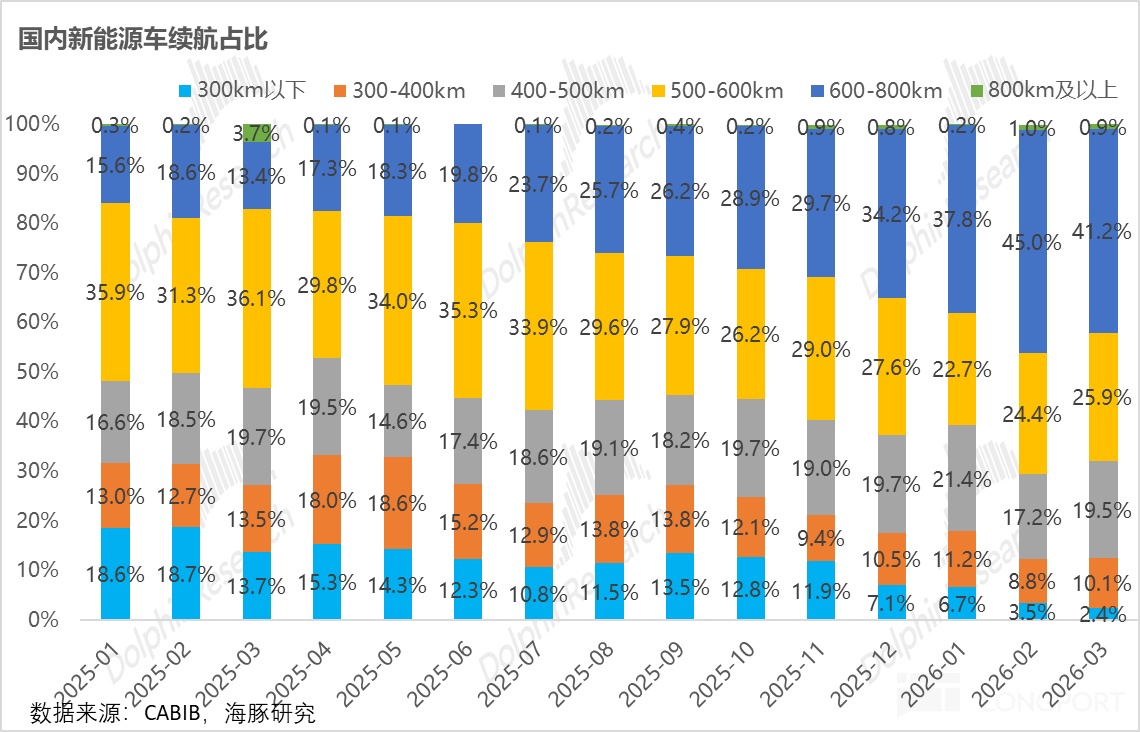
a. kWh per vehicle keeps rising: With BEV/PHEV mix stable, pack sizes continue to trend up. Per CABIA, Q1 domestic NEV avg. pack was 66.7 kWh (+34% YoY), with BEV at 65.3 kWh (+21.4% YoY) and PHEV at 36.2 kWh (+40.6% YoY).
The share of 600+ km range models rose to 40%–50% in Q1, well above 10%–20% a year ago. This is driven by:
BEVs’ high-capacity arms race: To relieve range anxiety and enhance premium competitiveness, OEMs are rolling out larger packs. For example, Nio models now start at 100 kWh, and Xiaomi SU7 mid/high trims use 96 kWh+ packs, indicating a shift from optional to standard long range.
EREVs trending toward ‘pure-electric-like’ use: To improve daily EV driving, range-extended models are moving from ~40 kWh toward 60–80 kWh (e.g., Leapmotor D19 at 80.3 kWh and higher-capacity Li Auto L-series versions).
b. Faster penetration of high-kWh commercial vehicles creates demand leverage
Penetration is rising fast, creating a leverage effect: Q1 domestic NEV commercial vehicle sales were 184k (+23.6% YoY), well above the overall commercial vehicle growth of 6%. Penetration climbed from ~4.5% in 2024 to nearly 7% in Q1 2026, driven by TCO advantages from falling battery costs and policy support, with heavy trucks and light logistics vehicles inflecting.
A powerful 1:4 demand effect: Avg. pack size in pure-electric commercial vehicles surged to ~200 kWh (vs. 118 kWh in Q1 2024), far above 60–70 kWh in BEVs. Each incremental commercial EV can thus equal the battery demand of 3–4 passenger BEVs. With commercial/special vehicles already ~1/3 of CATL’s power-battery volume, the leverage is significant.
Company alpha: share gains continue
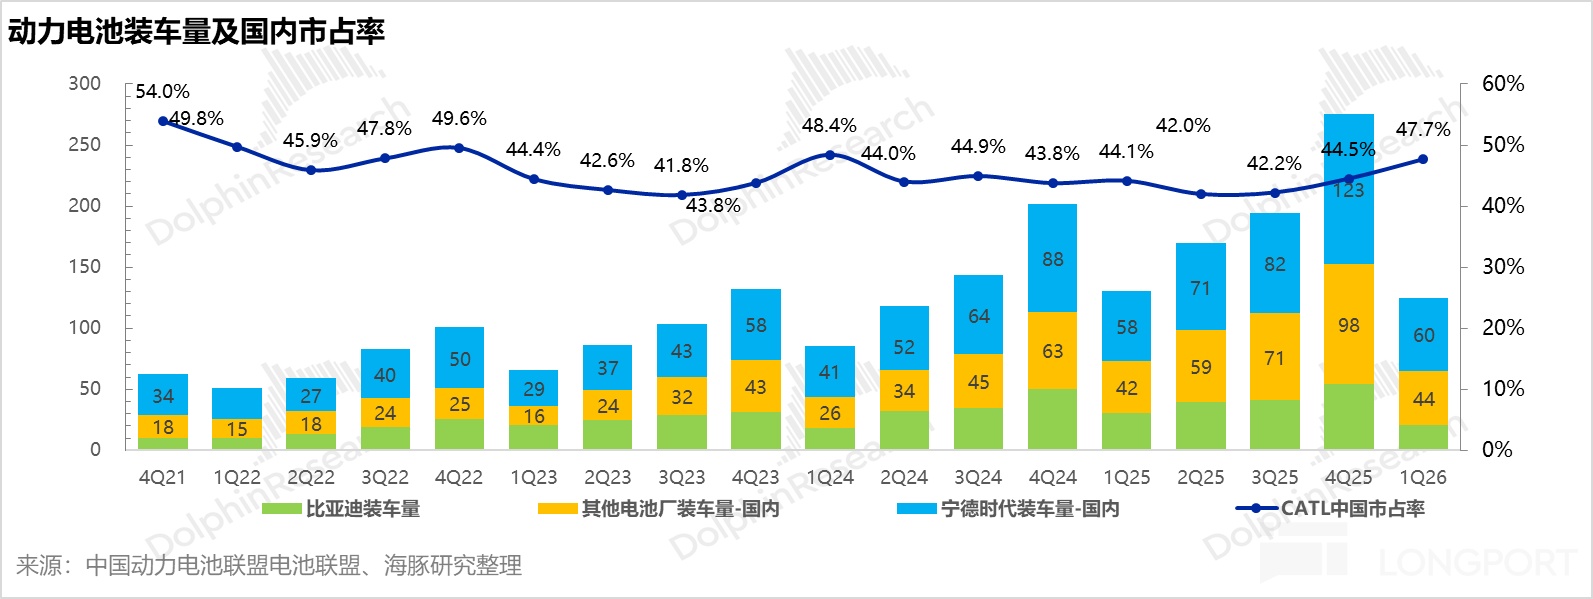
CATL’s market share rose further in Q1, up 3.2 ppt QoQ to 47.7%. Global power battery usage share was 40.5% in Jan–Feb 2026 (+1.8 ppt YoY), with overseas share at 32.1% (+2.2 ppt YoY), driven by capacity release after prior constraints and ramp of Shenxing and Kirin high-quality cells.
Company alpha: global share rising
Domestic share gains vs. peers: Q1 domestic share rose 3.2 ppt QoQ to 47.7%; excluding BYD (largely self-supplied), third-party market share rose 1.8 ppt QoQ to 57.3%.
Global capacity release and product strength: As of Jan–Feb 2026, global usage share reached 40.5% (+1.8 ppt YoY), with overseas at 32.1% (+2.2 ppt YoY). With prior full-capacity constraints easing and Shenxing/Kirin scaling, CATL’s global leadership strengthened.
② ESS shipments of 50 GWh, up 108% YoY, driven by demand and capacity ramp
Q1 ESS shipments were ~50 GWh (+108% YoY), in line with a highly buoyant market (China ESS battery sales +112% YoY). Growth was supported by strong end-demand and incremental capacity from CATL’s Jining base (>100 GWh planned), which began ramping in Q1 2026.
a. Policy and market resonance in China confirms the economic inflection
Nationwide capacity-tariff mechanism: In early 2026, the ‘Document No. 114’ established a grid-side capacity payment for independent storage. Pegged to coal power benchmarks, it provides stable capacity revenue and lifts IRR to ~8%–9%, catalyzing investment.
Capacity ramp supports deliveries: Jining’s new capacity is coming online in stages from 2026, alleviating bottlenecks and enabling high shipment growth.
b. AIDC as a new ESS growth engine
AI data centers create new storage needs from both grid and user ends:
Grid side: To integrate high shares of intermittent wind/solar, paired storage boosts effective capacity factors and grid stability.
User side:
Stabilizing AI loads: Training/inference loads are volatile and synchronized; storage smooths millisecond-level power pulses to safeguard operations.
Economics and interconnection speed: Storage enables peak-shaving arbitrage. In North America, operators like PJM and ERCOT require large new loads to self-balance, making storage key to faster interconnection approvals and energization.
b. ASPs: indexation underscores pricing power
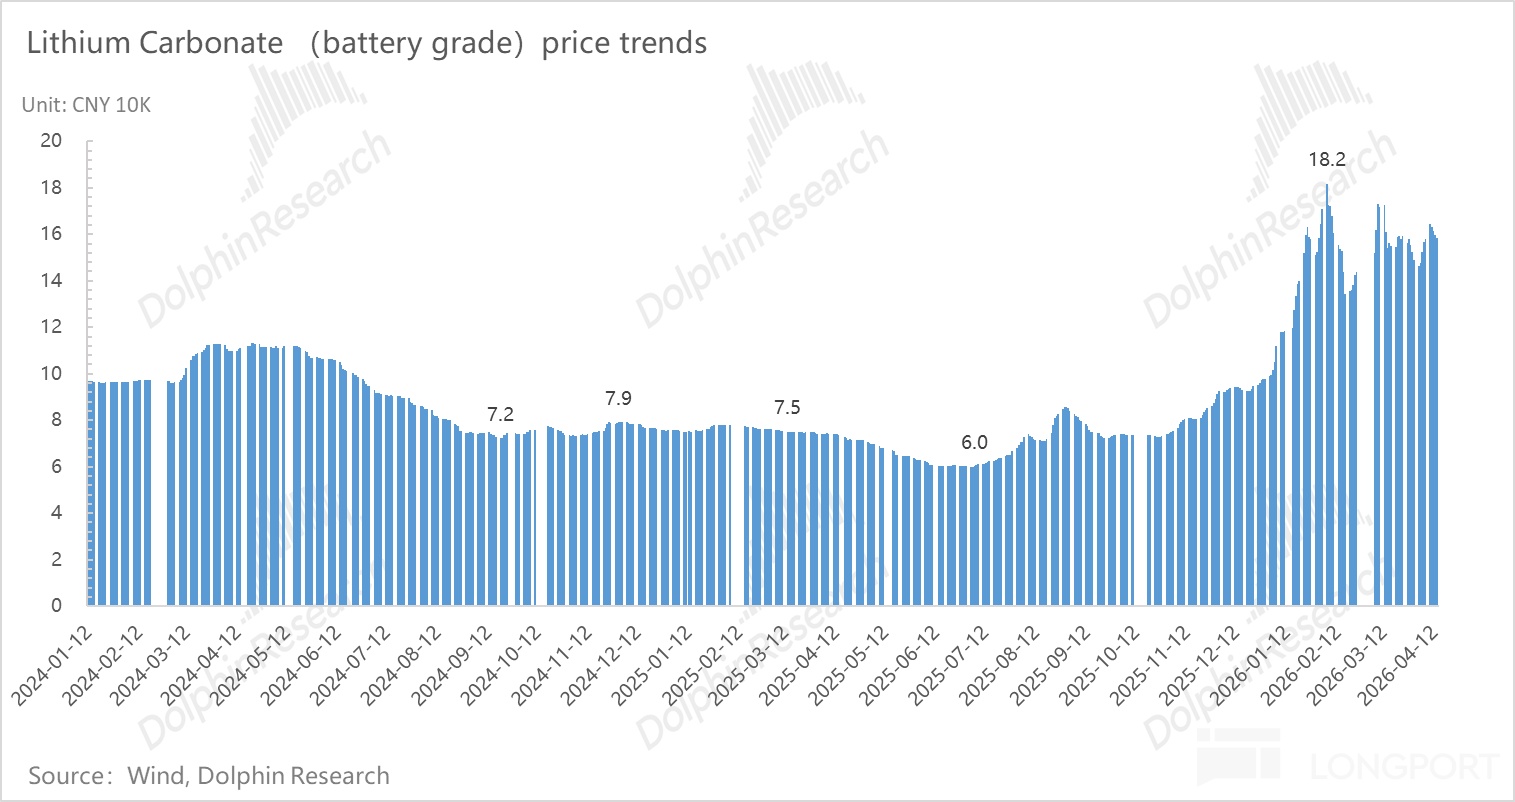
Blended battery ASP reached RMB 0.57/Wh in Q1, up 4% QoQ, despite two headwinds:
Upstream inflation: Lithium carbonate rebounded from RMB 80k–100k/ton in Q4 2025 to RMB 150k–180k/ton in Q1.
Mix pressure: ESS, which carries lower ASPs, saw its shipment mix rise 5 ppt to 25%, a structural drag on blended ASP.
Despite ‘cost up + mix down’, blended ASP still rose QoQ. This reflects strong bargaining power and metal-price indexation in most contracts, enabling pass-through of raw-material inflation and supporting firm ASPs.
2. GPM compressed QoQ but stayed resilient
Q1 2026 GPM was 24.8%, with GP/Wh down from RMB 0.18 in Q4 to ~RMB 0.16. While off the Q4 peak when utilization was at 103% (GPM 28.2%), performance met expectations and showed strong resilience.
Profitability faced several simultaneous headwinds:
Cost and mix pressure: Lithium carbonate surged to RMB 150k–180k/ton, and lower-margin ESS mix increased.
Seasonality and D&A: Utilization fell to 85%–90% from 103%, lifting unit D&A costs.
Policy impacts: Reduced export tax rebates mildly pressured reported margins.
Yet margins held steady thanks to CATL’s cross-cycle risk defenses:
① Inventory buffer: End-2025 inventories stood at RMB 94.5 bn (inventory/revenue 67%), allowing use of lower-cost inputs to smooth Q1 cost inflation.
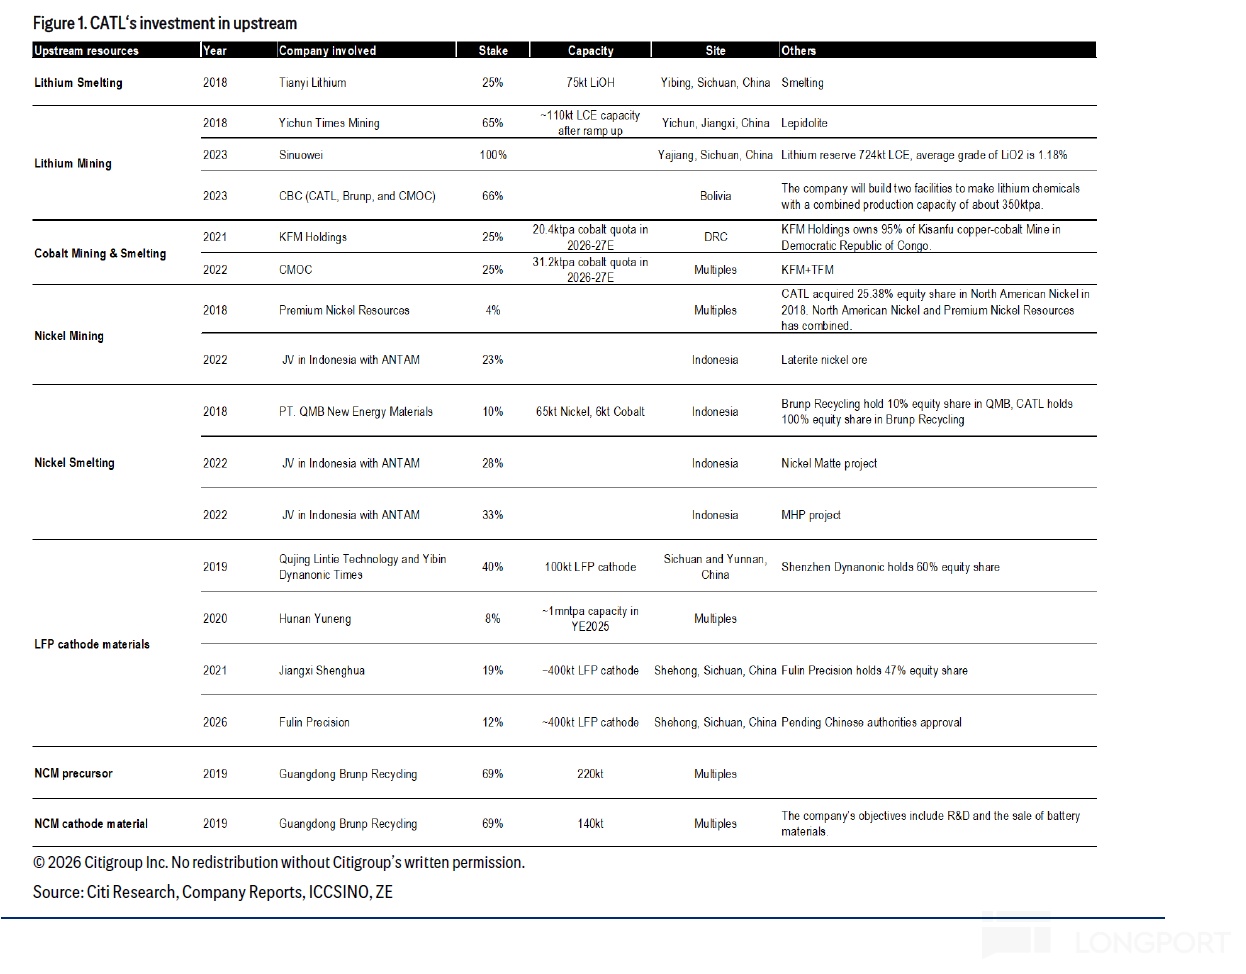
② Upstream hedges: Compared with the prior lithium upcycle, CATL’s resource hedge is stronger, including ~25% ownership in CMOC and a potential restart of its Jiangxi lithium assets (JXW) in 2026.
③ Scale and ‘fewer, bigger, better’ SKUs: Even during the off-season and expansion phase, 85%–90% utilization remains best-in-class. Scaled manufacturing on flagship products like Shenxing and Kirin continues to drive cost-downs.
④ Robust cost pass-through: With metal indexation and strong supply-chain clout, most cost increases from materials or policy changes are passed downstream.
II. Upcycle thesis intact; end-demand remains strong
① Utilization steady at 85%–90%; Q2 schedules remain full
Utilization dipped to 85%–90% from 103% in H2 2025 due to seasonality and a larger capacity base. Even so, that level is still among the highest in the industry, indicating healthy downstream pull.
Management guides Q2 schedules to remain full at 85%–90%. This reduces fears that slower EV demand could drag shipments and reaffirms CATL’s position in a volume-and-price upcycle.
2) Capex re-accelerates; expansion resumes onshore and offshore
After heavy 2021–2022 investments and a cyclical pullback starting Q1 2022 (troughing at ~RMB 6.7 bn in Q1 2023), capex bottomed and turned up from Q1 2024. This quarter reached ~RMB 12.4 bn, near the prior peak, signaling a new expansion phase.
CATL lifted its 2026 production target to 1.1–1.2 TWh versus ~772 GWh in 2025, implying ~400 GWh of additions and 42%–55% YoY capacity growth.
Global capacity plans are advancing:
Domestic expansions: Major hubs in Jining (Shandong), Zhaoqing (Guangdong, Ruijing Times), Yichun (Jiangxi), Xiamen (Fujian), Qinghai, and Ningde (Fujian) are scaling up. To meet ESS demand, Jining’s >100 GWh additions started ramping in Q1 2026 as planned.
Overseas ramp: International capacity will be a key volume driver.
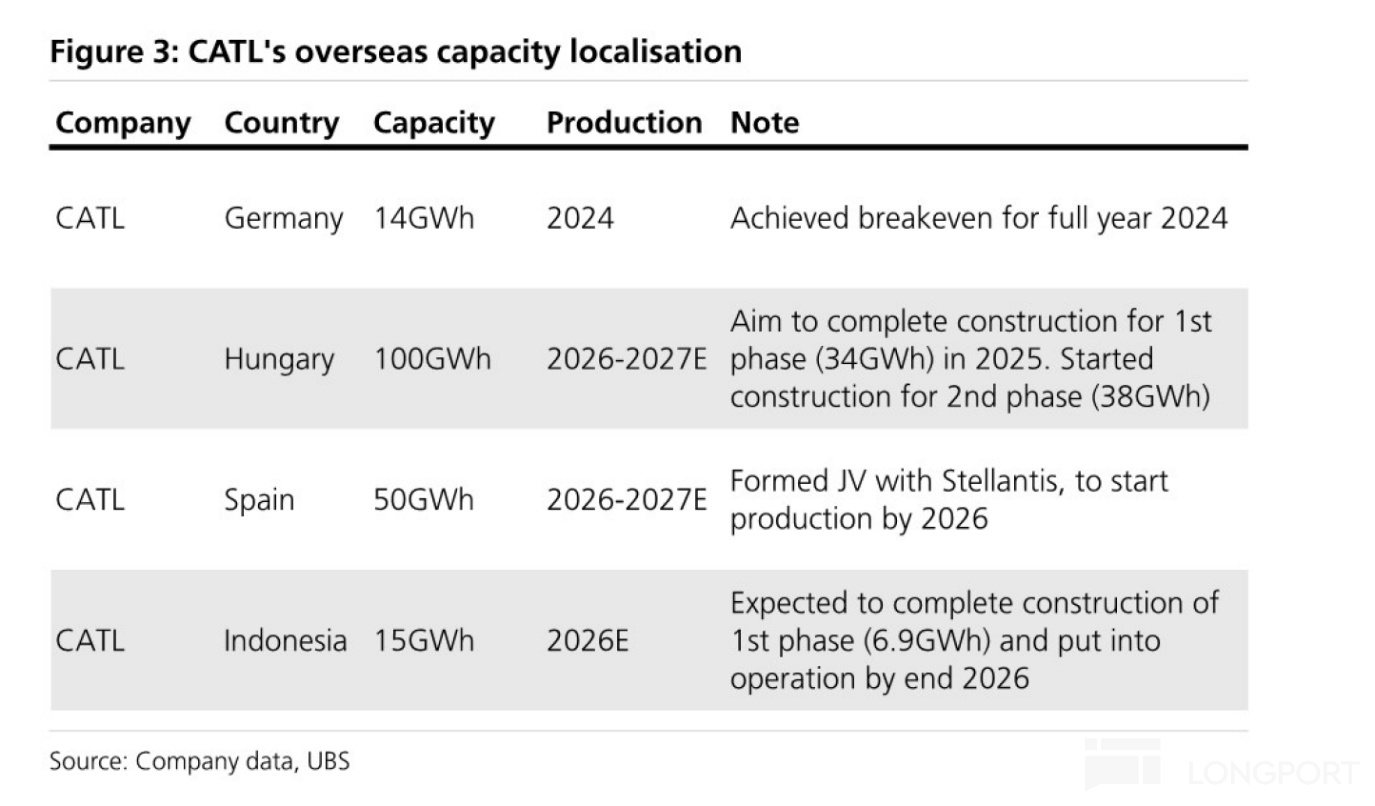
Europe: The Germany plant (14 GWh) has been in production since 2024 and is profitable. In Hungary (100 GWh planned), Phase I (34 GWh) cell lines are in commissioning, targeted by end-2025. Spain (60 GWh planned) cleared preliminary approvals and formed a JV, with groundwork slated to begin in 2026.
SE Asia: The Indonesia battery value-chain project is progressing well and is expected to start production in H1 2026.
Stronger capacity release underpinned CATL’s share gains in Q1 2026 and ensures supply for accelerating demand. The concentrated ramp in overseas markets in 2026 forms the backbone of high growth.
3) Inventory keeps rising, signaling robust orders
Quarter-end inventory rose to RMB 108.9 bn, up ~RMB 14.4 bn QoQ, a record high. Inventory/revenue climbed from 67% to 84%, with days rising to ~95.
Unlike passive inventory in a downcycle, this reflects proactive stocking and goods in transit in an upcycle. CATL is strategically building raw-material and WIP buffers to smooth cost volatility and support future production.
② Higher ‘goods delivered but not invoiced’:
Shift from cells to systems: With ESS systems rising in mix, longer on-site installation and commissioning extend accounting cycles, elevating inventory temporarily.
Longer logistics: Expansion beyond Europe into the Middle East and the Americas lengthens lead times, increasing in-transit inventory. As these goods are recognized in subsequent quarters, they should add visibility to revenue growth.
4) Contract liabilities remain high
As a B2B business, CATL books customer prepayments before delivery, making contract liabilities a proxy for backlog. Q1 contract liabilities were RMB 45.5 bn, down from RMB 49.2 bn, but still high.
With utilization high and Q1 shipments up 67% YoY, the QoQ dip reflects efficient conversion of backlog into revenue rather than order loss.
5) Asset impairments fell QoQ
Q1 impairment losses were ~RMB 1.4 bn, down RMB 3.2 bn from last quarter’s peak of RMB 4.6 bn. As a share of revenue, impairments fell by ~2 ppt to just 1.1%.
Dolphin believes this reflects ample prior provisioning and stabilizing upstream prices. With prior burdens cleared and price risks eased, profit flow-through improved.
Q1 attributable net income was RMB 20.7 bn (+49% YoY), beating the street’s RMB 17.6 bn. Ex-one-offs, net income was RMB 16.4 bn (+53% YoY).
Beats were driven by volume strength and robust pass-through, lifting revenue and gross profit. Tight control of R&D and opex, plus lower impairments, further boosted reported earnings.
Net profit per Wh held at ~RMB 0.10, flat QoQ. Maintaining unit profitability despite a sharp lithium rebound refutes the view that raw-material inflation would erode margins and showcases CATL’s cross-cycle strength.
Dolphin’s focus on core OP (GPM minus S&A and asset/credit losses) shows Q1 at RMB 20.5 bn (+94% YoY), with core OPM at 15.9%, flat QoQ. This confirms continued operating strength.
Deep dives:
Jul 05, 2026: ‘CATL: H-share premium >20%, time for a valuation re-rate?’
Jan 23, 2026: ‘Reading CATL through TSMC: an inescapable cycle’
Jul 14, 2021: ‘CATL (II): has faith built a rigid bubble?’
Jul 07, 2021: ‘CATL (I): what underpins the trillion-yuan valuation?’
Earnings trackers:
Mar 10, 2026: ‘CATL: Full-Throttle Capacity, Roaring Back in the AI Infra Era’
Jul 31, 2025 Trans: ‘CATL (2Q25 Trans): Europe NEV growth sustained; local capacity ramping’
Jul 31, 2025: ‘CATL: price war shows the limits of industry competition’
Apr 14, 2025 Trans: ‘CATL (1Q25 Trans): limited tariff impact; working with customers on solutions’
Apr 14, 2025: ‘Tariff hit: CATL’s tough passage’
Mar 16, 2025 Trans: ‘CATL (4Q24 Trans): Shenxing/Kirin share to reach 60%–70% in 2025’
Mar 16, 2025: ‘Another deep dip: is it really that scary?’
Risk disclosure and disclaimer: Dolphin Research Disclaimer and General Disclosures
Recommended Articles










Comments (0)
Click the $ button, enter the symbol, and select to link a stock, ETF, or other ticker.