


Ever Heard of the Michael Saylor-Warren Buffett Ratio? It Just Did Something for the First Time Since 2000 and Could Trigger a Big Stock Market Move.



Aside from being multibillionaires, Berkshire Hathaway (NYSE: BRK.A)(NYSE: BRK.B) CEO Warren Buffett and MicroStrategy (NASDAQ: MSTR) CEO Michael Saylor don't have too much in common. One is a traditional investor in his mid-90s while the other is in his late 50s and has branched out into newer investing ideas. Buffett has previously referred to Bitcoin (CRYPTO: BTC) as "rat poison squared," while Saylor thinks the price of Bitcoin could reach $13 million by 2045.
However, a former Ivy League finance professor and portfolio manager thinks there could be a correlation between MicroStrategy's and Berkshire's stocks. He has coined this correlation the Saylor-Buffett ratio. Interestingly, the ratio is doing something it hasn't done since 2000, which could trigger a big move for the stock market.
What is the Saylor-Buffett Ratio?
Owen Lamont, a portfolio manager at Acadian Asset Management, created the Saylor-Buffett ratio and recently discussed the concept in a blog post. Lamont has been using the ratio to monitor fear and greed in the market.
Sentiment is an important factor in determining what the market might do next. While many believe in efficient markets (and many others don't), markets are rarely efficient when one might expect and sentiment can be a reason. If investors are enthusiastic about stocks it will likely take some time for the whole market to settle down even if the market is overvalued. The same concept applies when markets are struggling -- valuations might be attractive, but investor sentiment is negative and risk-averse.
Lamont considers Buffett and Berkshire to represent more traditional companies in the market, which makes sense considering Berkshire operates insurance, mortgage, railroad, and energy businesses. Saylor is on the other end of the spectrum with a high-octane growth mindset. The Saylor-Buffett ratio looks at the total cumulative return of MicroStrategy's stock divided by the total cumulative return of Berkshire's Class B shares. Lamont acknowledges that he made up the ratio and that it's not a "scientifically valid measure derived from first principles."
What is the ratio saying right now?
When the ratio is high, MicroStrategy's stock outperforms Berkshire's. This reflects investor exuberance in riskier assets and greed, and likely means the market is overvalued or getting frothy. Lamont found the ratio peaked at 18 in February 2000 right before the dot-com crash the following month. The Saylor-Buffett ratio spent most of the next two decades below 1, meaning investor exuberance settled down and favored subtle, proven long-term investing, a trend Buffett and Berkshire have embodied for decades. However, the ratio started to make waves in 2020 around the time the meme-stock craze hit the market. I have recreated Lamont's chart below. The numbers are not exact, but they plot a very similar trend to his graph.
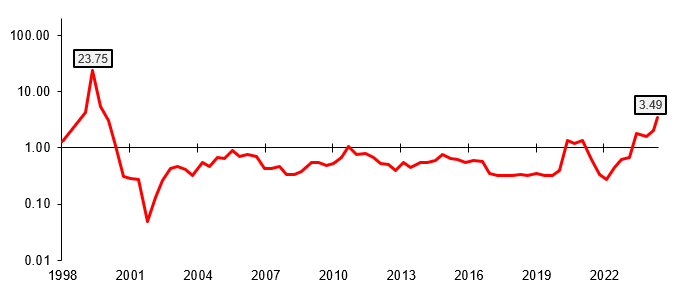
Data source: Acadian Asset Management. Chart by author.
The ratio peaked its head above 1 in 2020 during the meme-stock craze. Then it dipped as stocks sold off in 2022 but is now steadily climbing. Recently, the Saylor-Buffett ratio reached its highest level since the dot-com bubble. The ratio is not nearly as high, which one could perceive to mean that the bull market has room to run. However, it's also possible investors learned a valuable lesson in 2000 and won't be that enthusiastic again.
The clear takeaway is that things are getting frothy -- and the Saylor-Buffett ratio is not the only indicator of this. The S&P 500 Shiller CAPE ratio, which looks at the price of the broader market divided by the 10-year average of inflation-adjusted earnings, has also gotten to levels not seen since the early 2000s and 2021.
Berkshire has also spent much of the year stockpiling cash and staying away from stocks. The tricky part is that the future is always different from the past. While the market could correct simply due to the high valuations, it's also possible that a future stock market collapse will be triggered by factors at least partially different from the last few corrections. Nonetheless, investors should take the Saylor-Buffett ratio as another warning about the market and proceed cautiously.
Don’t miss this second chance at a potentially lucrative opportunity
Ever feel like you missed the boat in buying the most successful stocks? Then you’ll want to hear this.
On rare occasions, our expert team of analysts issues a “Double Down” stock recommendation for companies that they think are about to pop. If you’re worried you’ve already missed your chance to invest, now is the best time to buy before it’s too late. And the numbers speak for themselves:
- Nvidia: if you invested $1,000 when we doubled down in 2009, you’d have $381,173!*
- Apple: if you invested $1,000 when we doubled down in 2008, you’d have $43,232!*
- Netflix: if you invested $1,000 when we doubled down in 2004, you’d have $469,895!*
Right now, we’re issuing “Double Down” alerts for three incredible companies, and there may not be another chance like this anytime soon.
*Stock Advisor returns as of November 18, 2024
Bram Berkowitz has positions in Bitcoin. The Motley Fool has positions in and recommends Berkshire Hathaway and Bitcoin. The Motley Fool has a disclosure policy.
Recommended Articles








Comments (0)
Click the $ button, enter the symbol, and select to link a stock, ETF, or other ticker.