


Chainlink Price Forecast: LINK holds onto recent gains as buyback boosts demand



- LINK bounces off a local support trendline, with bulls eyeing further gains.
- Chainlink announced a buyback of over 43,000 tokens on Thursday.
- Derivatives data suggest steady demand for LINK, supporting the upside potential.
Chainlink (LINK) trades above $24 at press time on Friday, holding onto the more than 2% gains from Thursday, driven by the buyback of over 43,000 tokens. As LINK remains steady, the derivatives data suggest increasing optimism as open interest and bullish bets rise.
Chainlink expands the LINK reserves
Chainlink Reserve added 43,067.70 LINK tokens on Thursday, expanding the total holding to 323,116.40 LINK tokens. The buyback action represents increased confidence of the Chainlink team, while the reduced supply fans the rising demand.
Notably, Chainlink accumulates LINK tokens using the off-chain revenue generated from corporate enterprises and on-chain revenue from services.
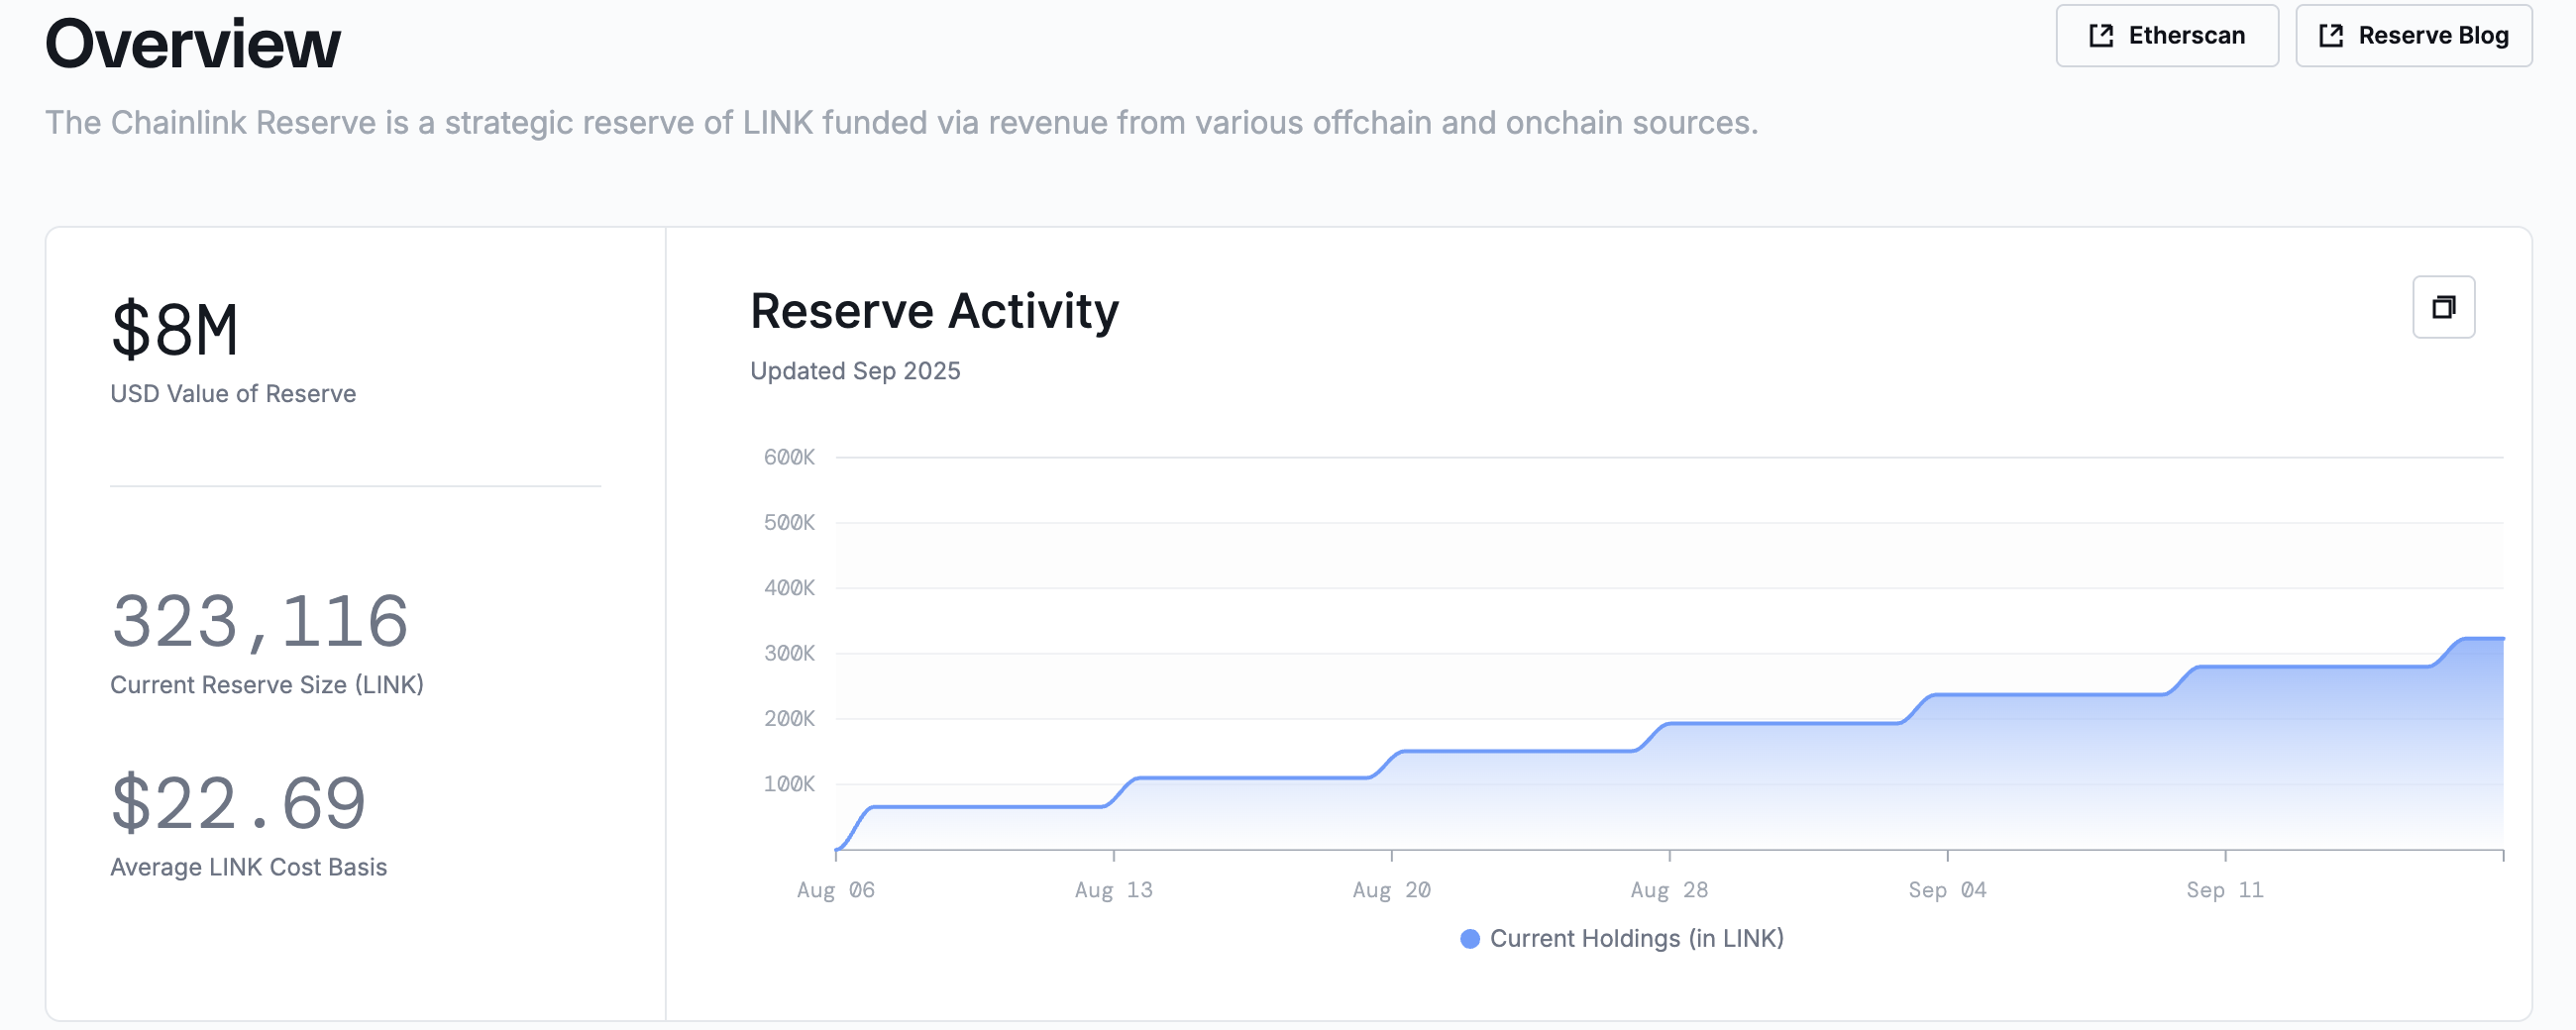
LINK Reserves. Source: Chainlink
Derivatives data suggest rising optimism
CoinGlass data shows that the bullish bets on LINK have consistently increased to 50.18% over the past three days, from 48.89% on Wednesday. This indicates a significant increase in risk-on sentiment among investors.
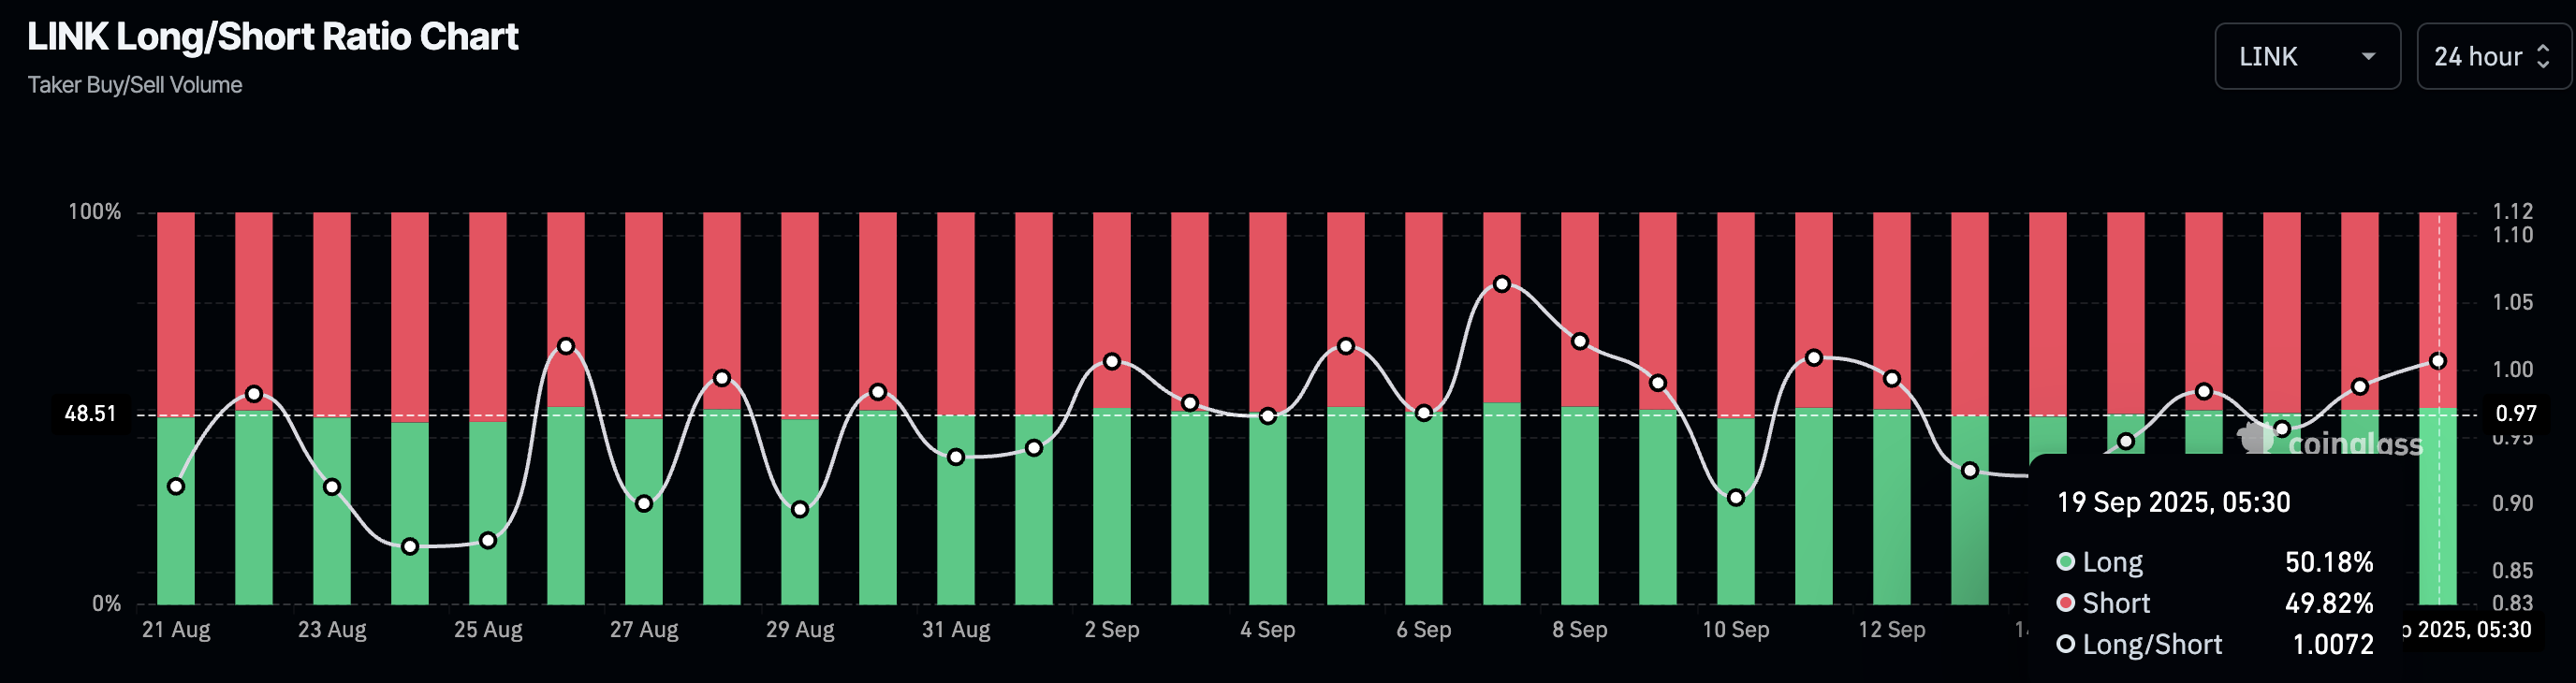
LINK Long/Short Ratio Chart. Source: CoinGlass
Validating elevated demand, LINK Open Interest (OI) stands at $1.70 billion, down from $1.77 billion on Thursday. Despite the decline, LINK OI remains elevated, maintaining a short-term recovery phase after bouncing off the $1.50 billion level in early September.
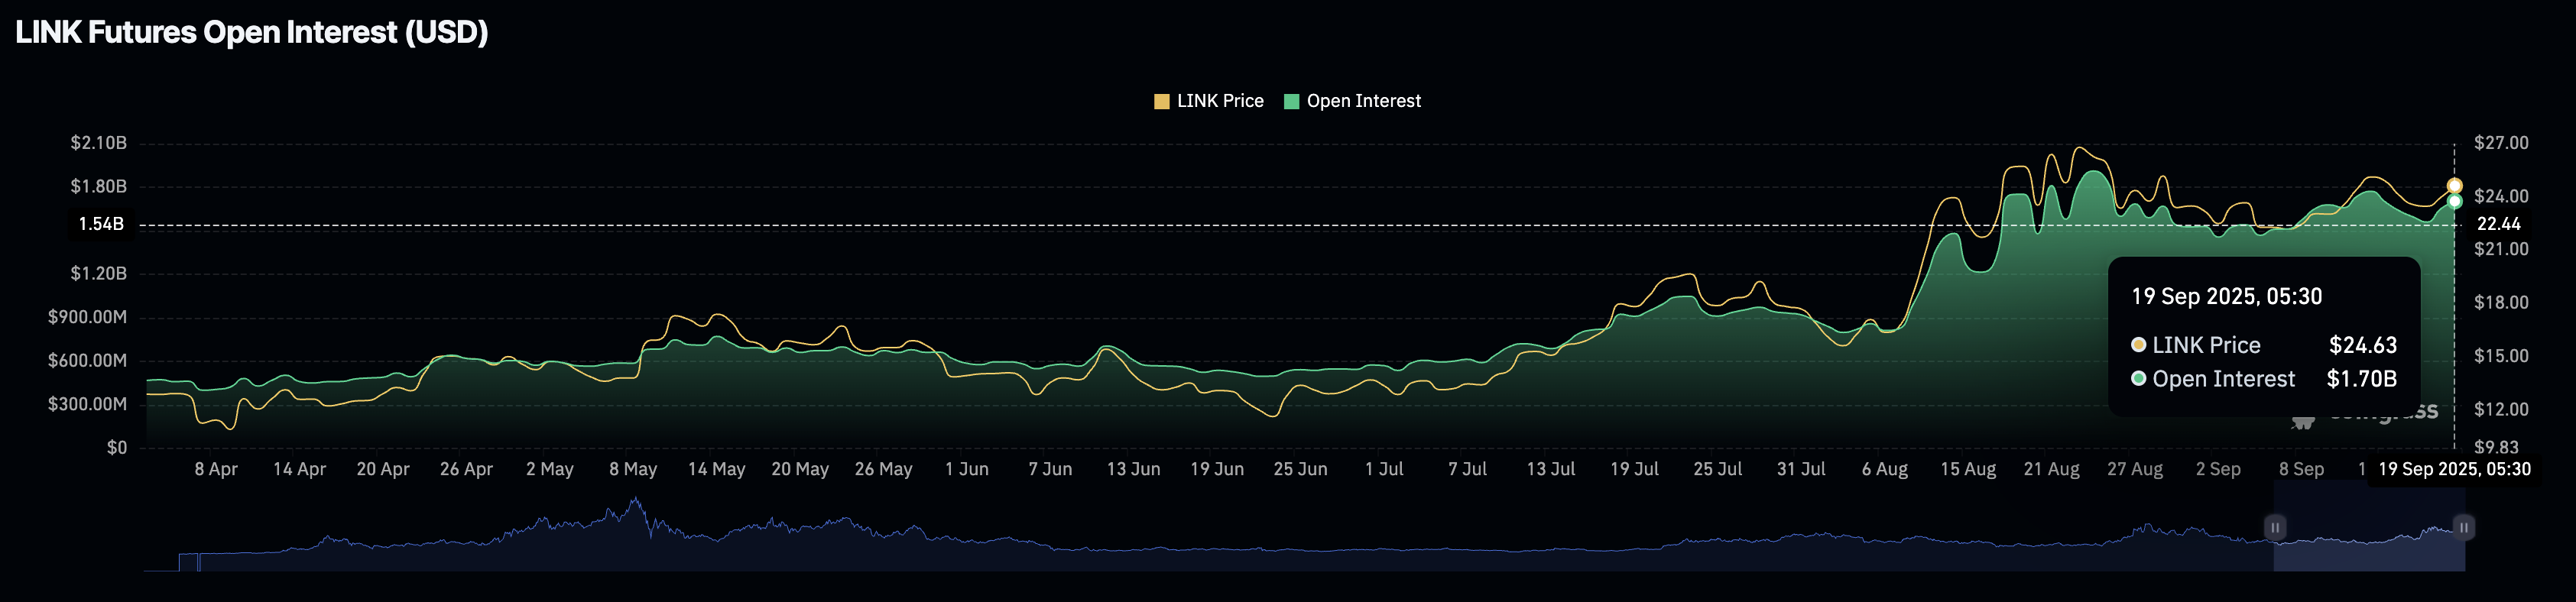
LINK Open Interest. Source: CoinGlass
Chainlink’s rebound from a key support holds momentum
Chainlink upholds a recovery run, bouncing off a local support trendline on the daily chart, formed by connecting the lows of June 22 and August 2. LINK holds above the 78.6% Fibonacci retracement level at $24.35, which is drawn from the $30.94 high of December 13 to the $10.10 low of April 7.
A decisive close above $24.35 could extend the LINK rally to the previous week’s high at $25.64. Beyond this, Chainlink could find opposition near August’s high at $27.87, followed by the December 3 high of $30.94.
Adding to the bullish potential, the Relative Strength Index (RSI) bounced off the halfway line to 56 on the daily chart, suggesting increasing buying pressure.
Still, the Moving Average Convergence Divergence (MACD) converged with its signal line, which moves sideways above the zero line on the same chart. This indicates a neutral, indecisive shift in trend momentum from bearish.
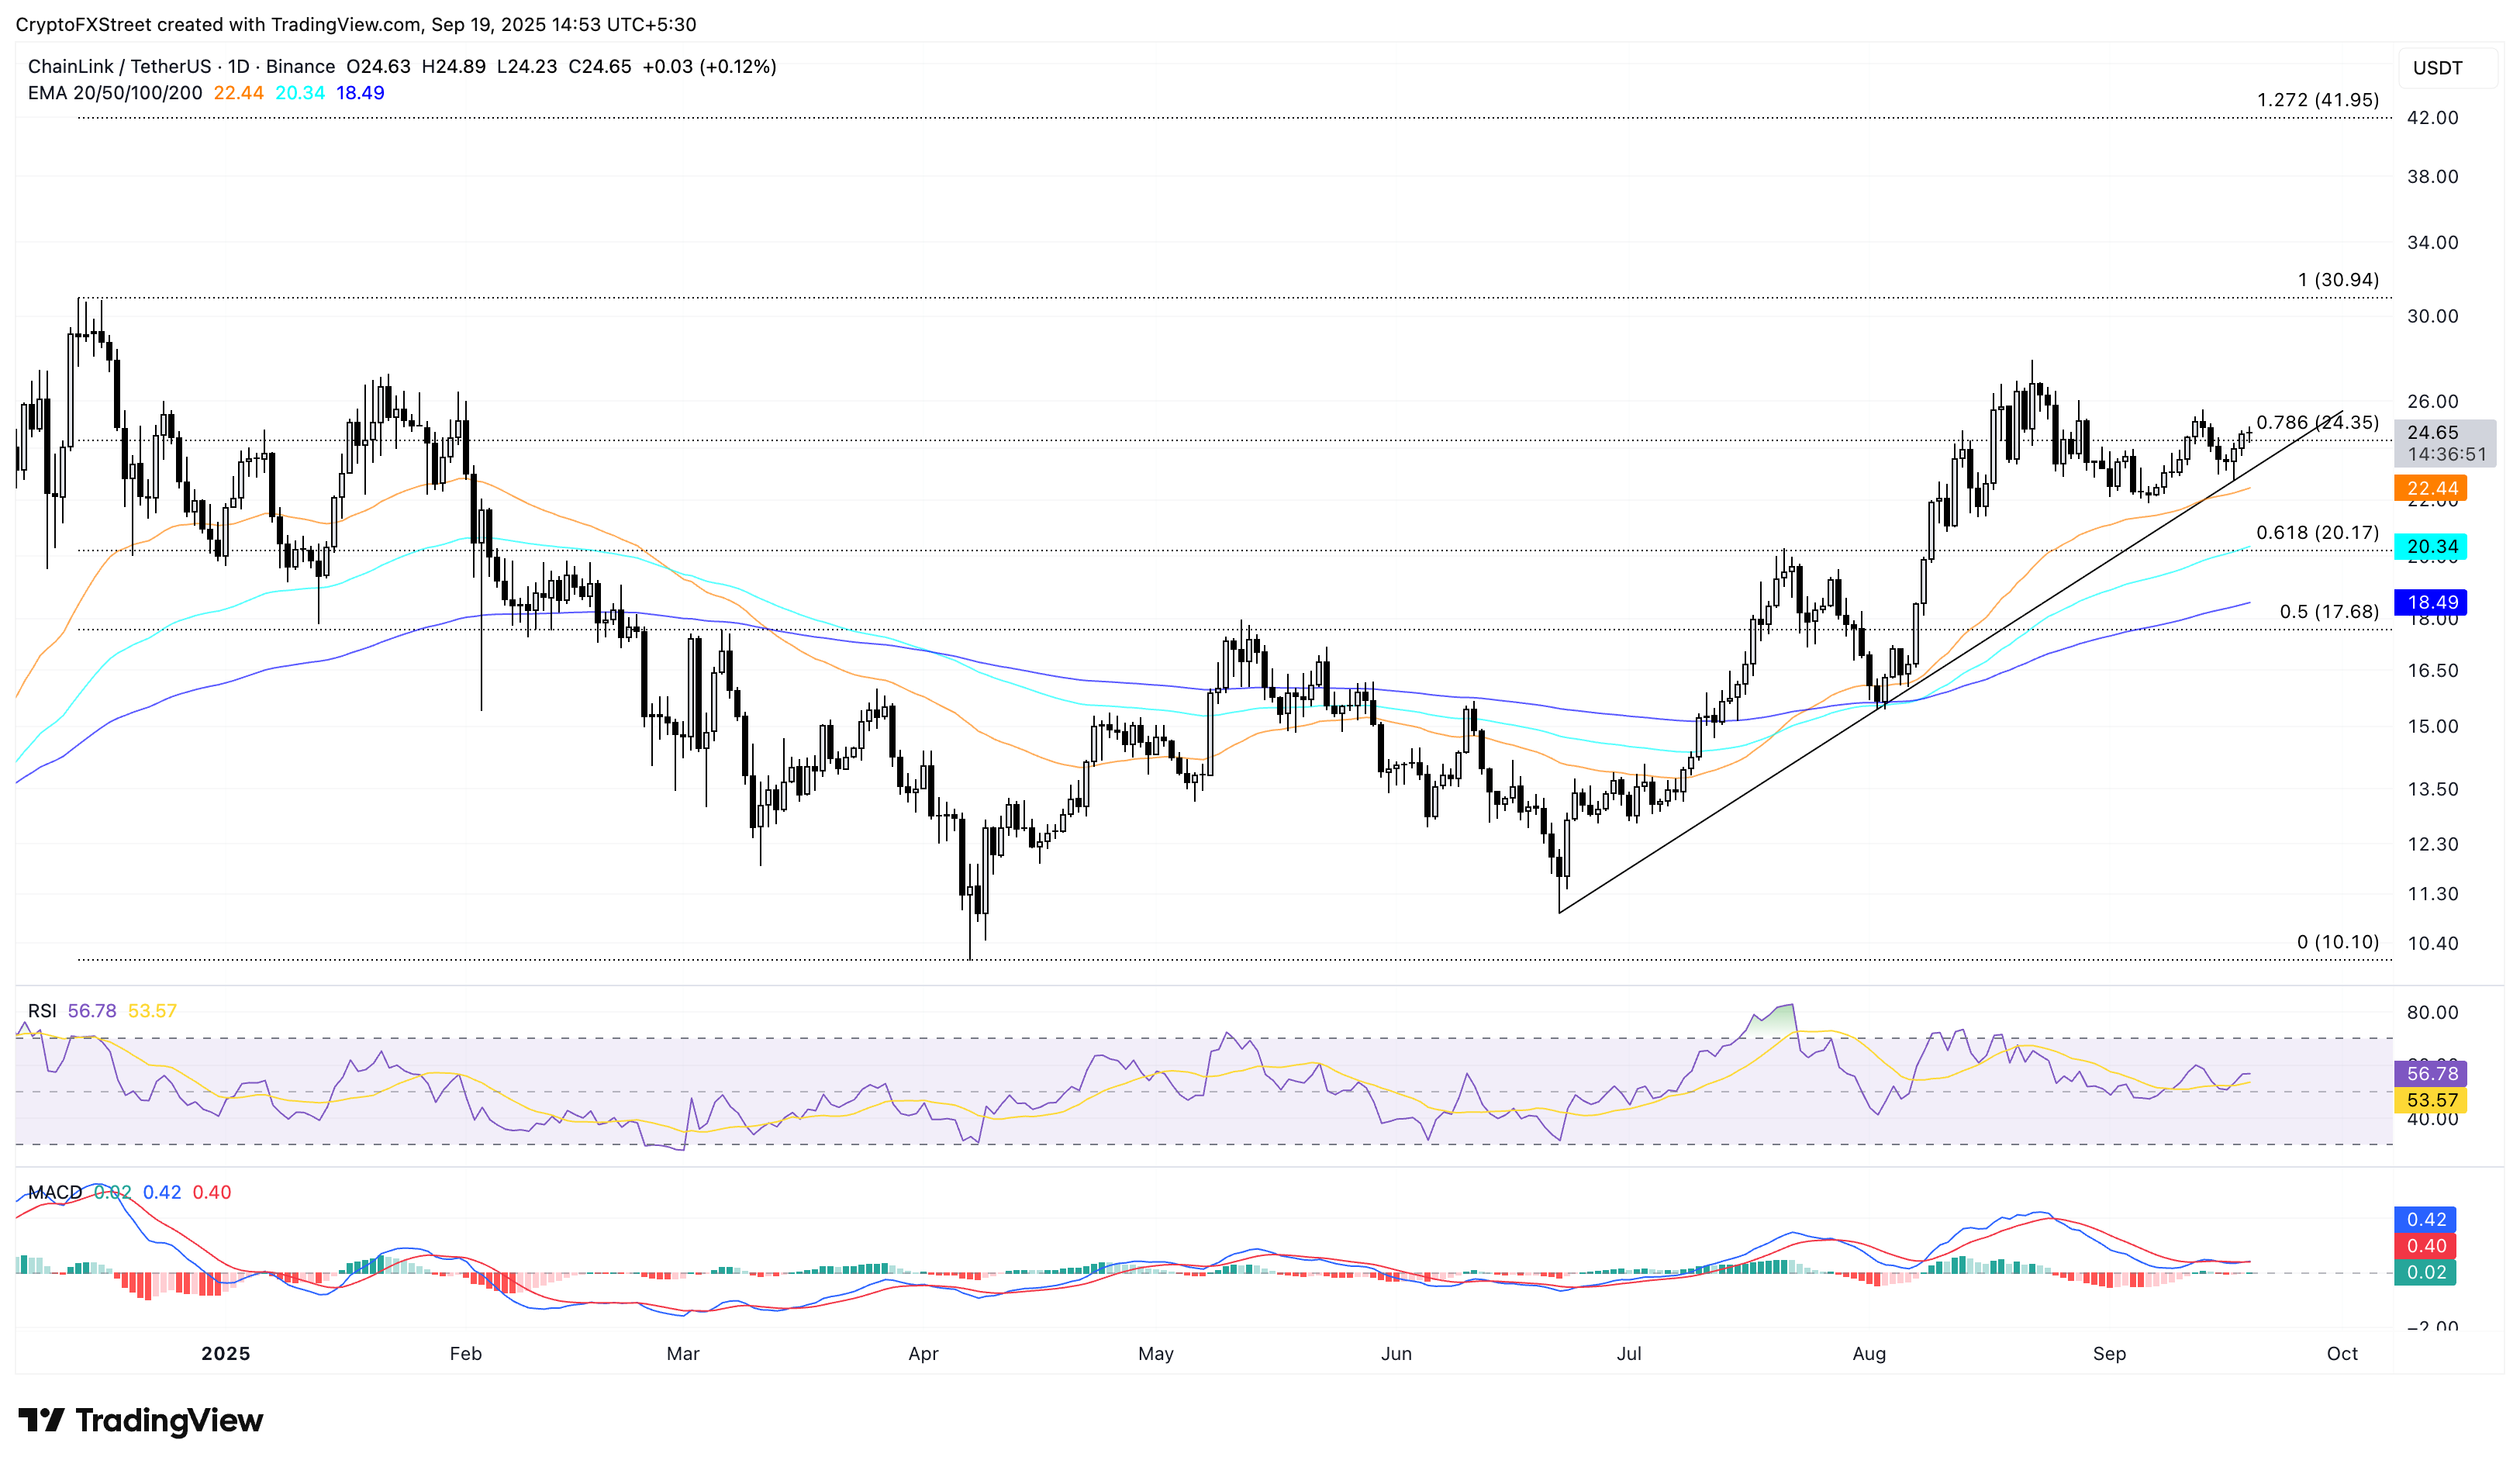
LINK/USDT daily price chart.
Looking down, if LINK reverses to close below Wednesday's low at $22.75, it would confirm the support trendline breakdown. In such a case, the 50-day Exponential Moving Average at $22.44 could act as the immediate support level, followed by the 100-day EMA at $20.34.
Recommended Articles









Comments (0)
Click the $ button, enter the symbol, and select to link a stock, ETF, or other ticker.