


Avalanche incentivizes developers with $250,000 grants as C-chain activity surges



- Avalanche approaches the apex of an ascending triangle pattern, with bulls targeting the $26 supply zone breakout.
- The C-chain transaction count hits a year-to-date high of 2 million, indicating increased developer activity.
- The Avalanche Foundation incentivizes eight projects with a $250,000 grant under the Retro9000 Cohort 2 support.
Avalanche (AVAX) edges higher by 1% at press time on Thursday, approaching the apex of an ascending triangle pattern as traders anticipate an outcome shortly. The increased developer activity on Avalanche’s contract chain (C-chain) reached a year-to-date high of 2 million transactions on Sunday.
Furthermore, the Avalanche Foundation aims to catalyze further development activity through the Retro9000 Cohort 2 incentives.
Avalanche Foundation pushes developer activity with $250,000 in grants
Snowtrace data shows that Avalanche C-chain, a dedicated layer for smart contracts and decentralized applications (dApps), reached an annual high of 2 million transactions on Sunday. A rise in C-chain transactions relates to increased production or activity from developers pushing new dApps or smart contracts.
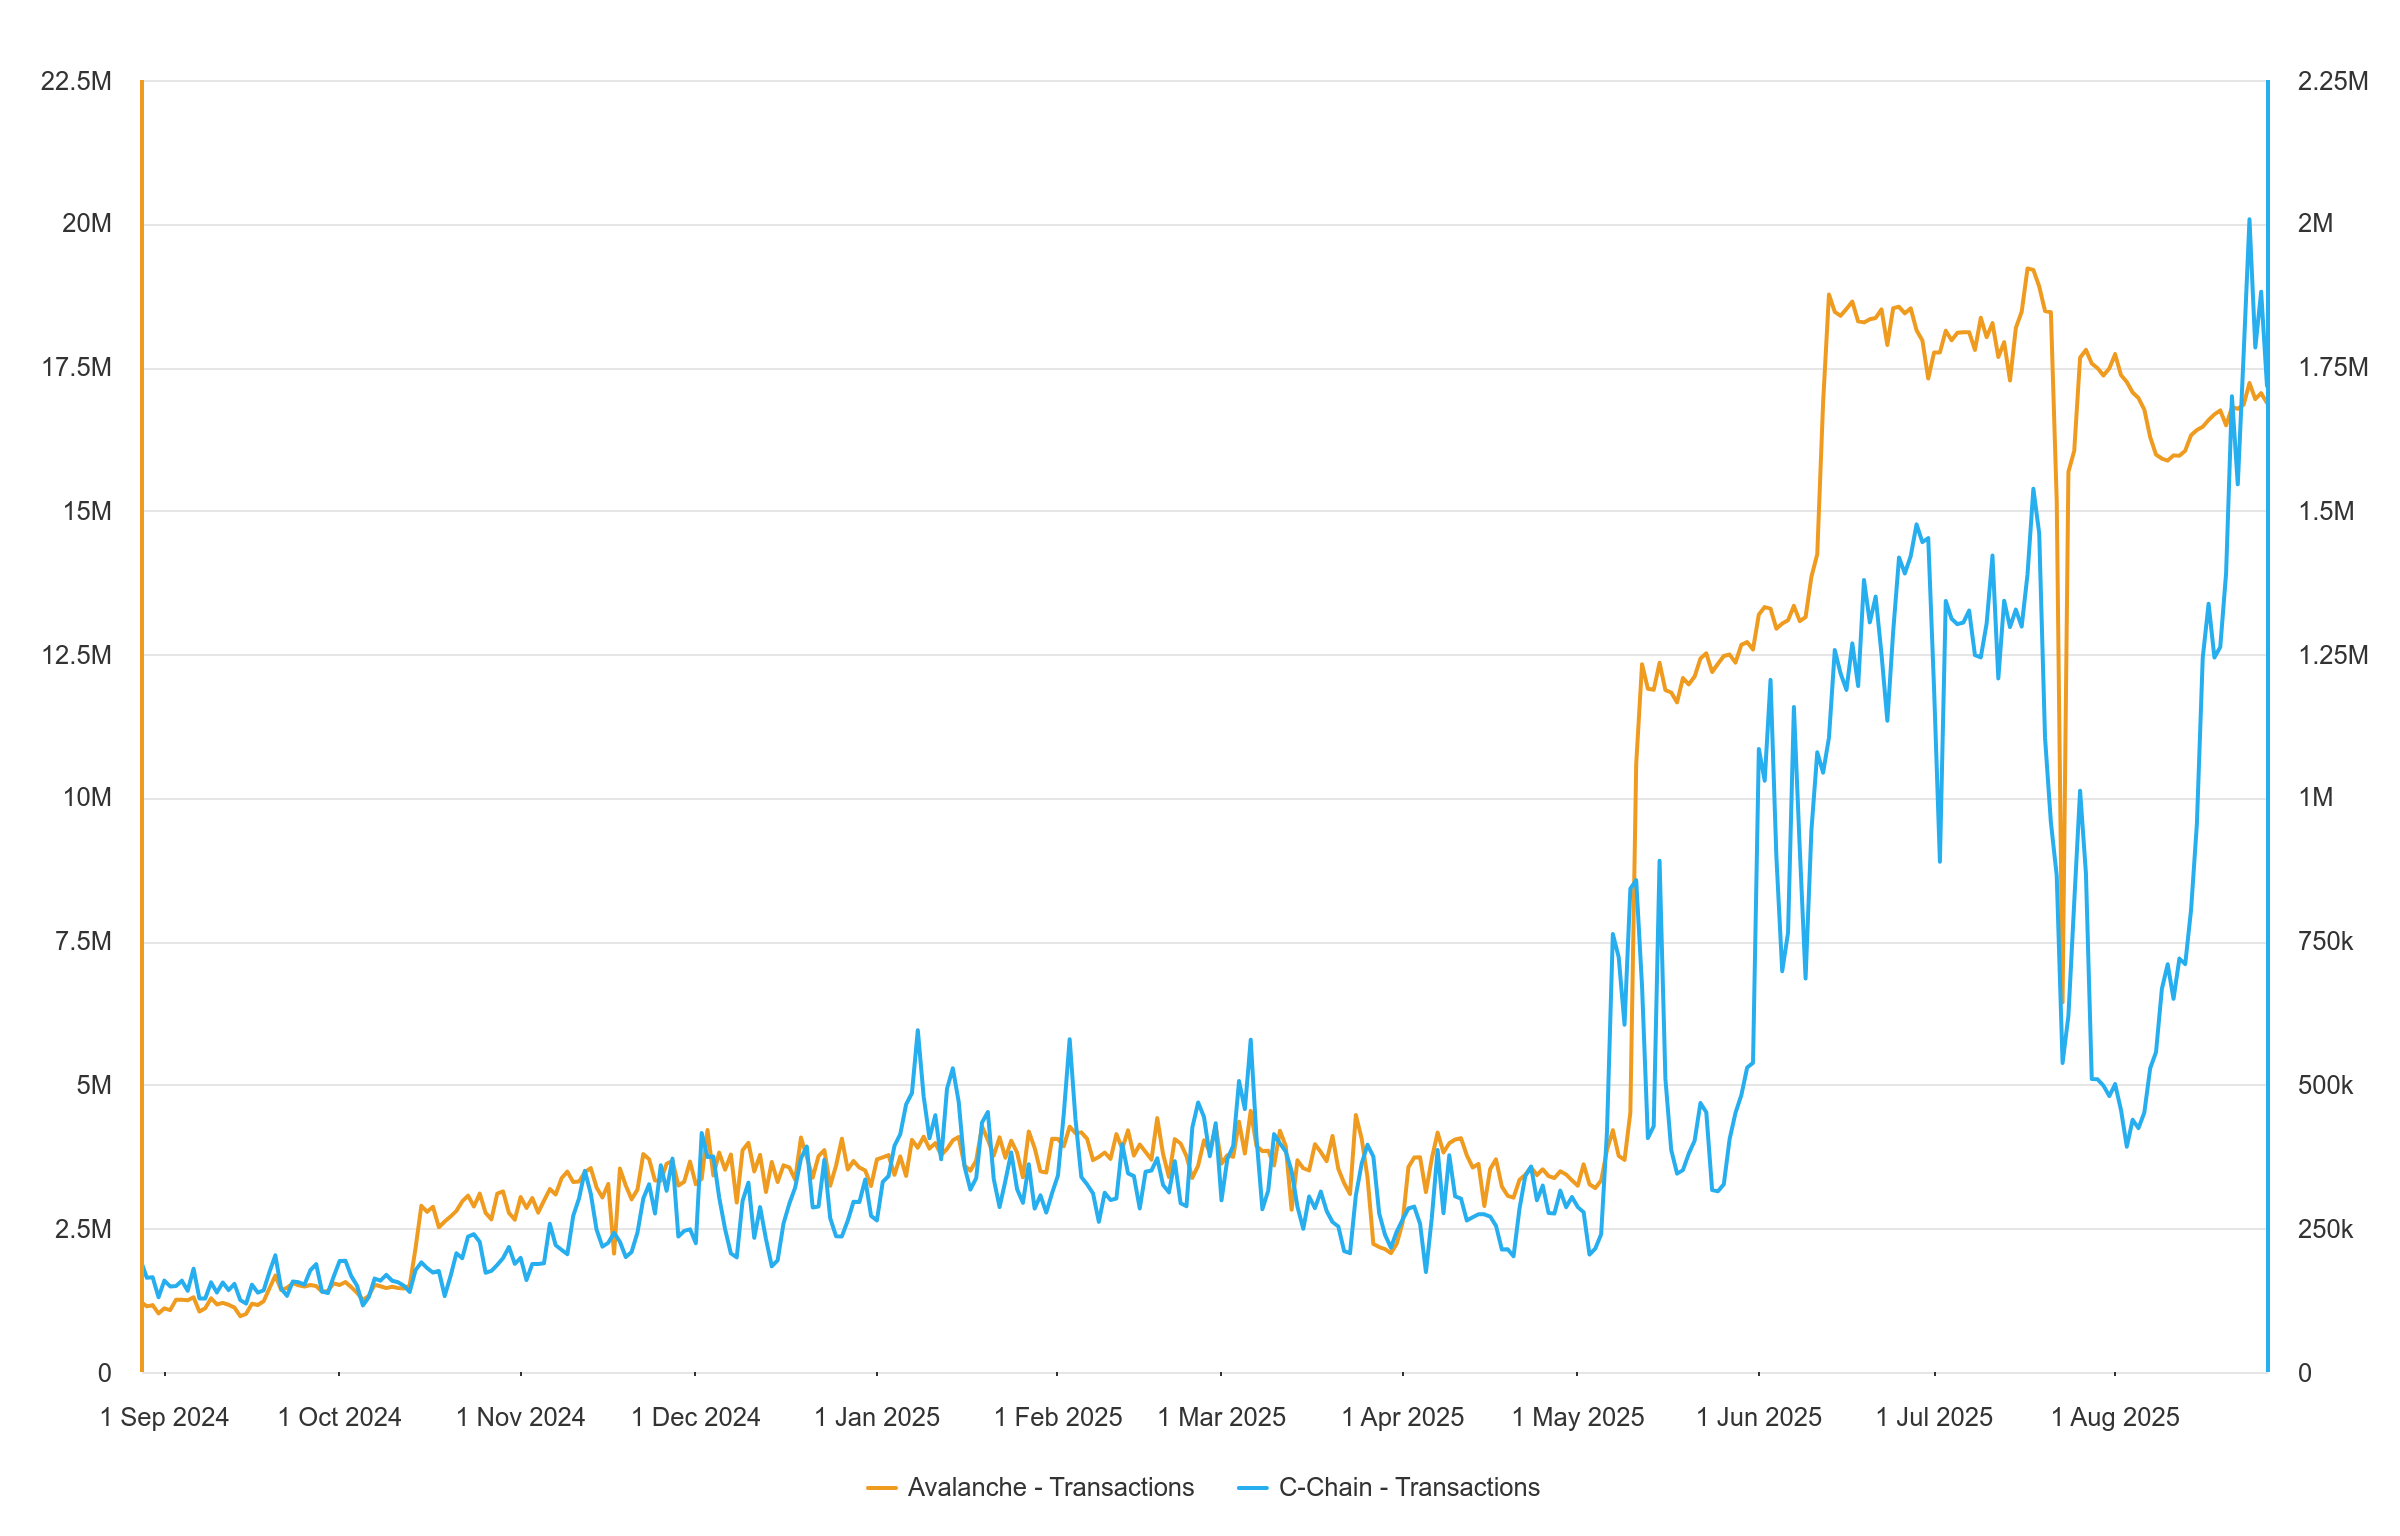
Avalanche C-chain transactions. Source: Snowtrace
As the Avalanche’s development layer heats up, the Avalanche Foundation has announced the release of $250,000 in grants to eight projects from the $40 million Retroactive9000 pool. The pool was announced in late 2024 and previously rewarded over $1 million to 19 projects in June.
AVAX nears the crossroads at the end of an ascending triangle pattern
AVAX bounces off within an ascending triangle pattern formed on the daily chart (shared below) from the support trendline formed by connecting the lows of June 22 and August 3. The recovery run extends for the third consecutive day, with bulls eyeing a challenge to the $26 supply zone, acting as the triangle’s ceiling, and marked yellow on the same chart.
If AVAX extends the recovery run above the supply zone with a clean push, it could extend the rally to $32.00, aligning with the R2 pivot level.
Adding a bullish bias to the technical outlook, the rising 50-day Exponential Moving Average (EMA) inches closer to the 200-day EMA for a Golden Cross. This would mark a bullish shift in the short-term trend, outpacing the prevailing slowdown.
Still, the momentum indicators maintain a neutral stance on the daily chart, as the Moving Average Convergence Divergence (MACD) and its signal line move flat above the zero line, in an intertwined fashion. Furthermore, the Relative Strength Index (RSI) at 52 on the same chart holds above the halfway midline, indicating a cool-off period in buying pressure.
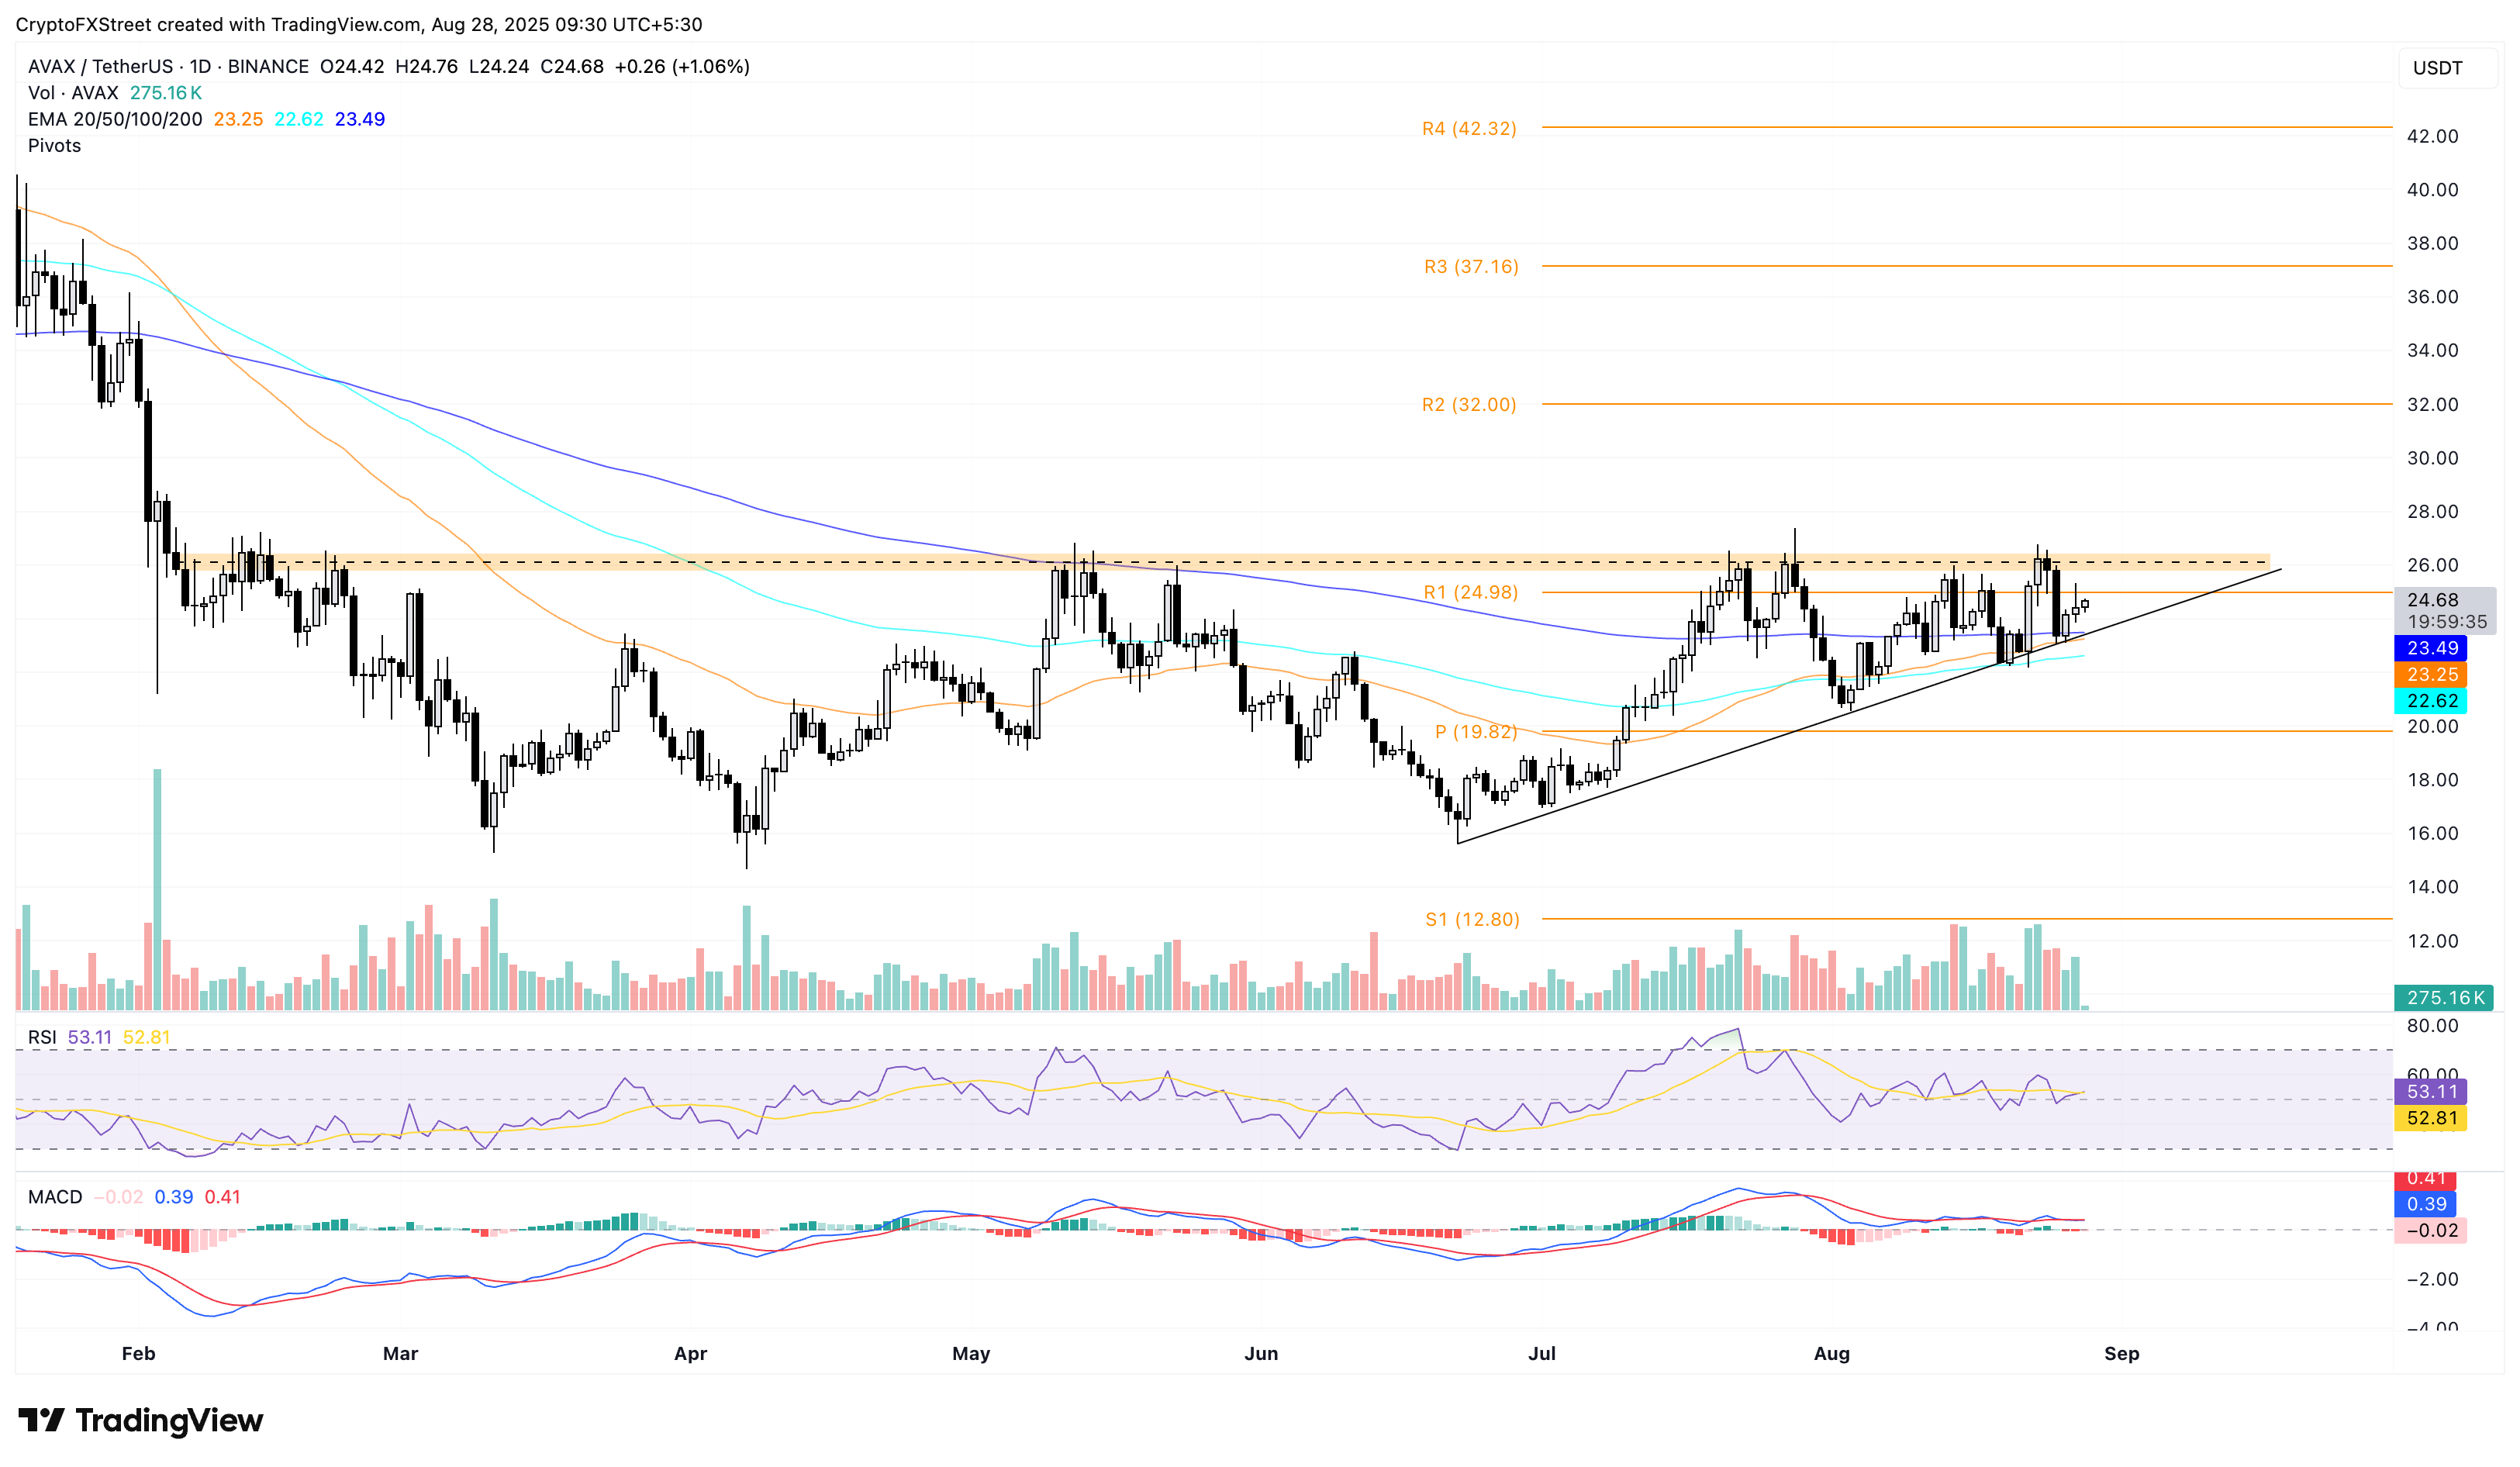
AVAX/USDT daily price chart.
Looking down, a break below the 200-day EMA at $23.49, aligning with the support trendline, would invalidate the triangle pattern. This could extend the downfall in AVAX to the centre Pivot level at $19.82.
Recommended Articles









Comments (0)
Click the $ button, enter the symbol, and select to link a stock, ETF, or other ticker.