


Meme coins struggle as Dogecoin, Shiba Inu, and Pepe face bearish pressures



- Dogecoin nears the apex of a symmetrical triangle pattern, hinting at a potential breakout.
- Shiba Inu slips to the 50-day EMA, struggling to retain the 8% gains from Friday.
- Pepe consolidates as two crucial moving averages hint at a Death Cross pattern.
Meme coins, such as Dogecoin (DOGE), Shiba Inu (SHIB), and Pepe (PEPE), are under pressure following a weekend pullback. Capital outflows from the derivatives market deplete the open interest of meme coins, reflecting a shift to risk-off sentiment.
Open Interest of DOGE, SHIB, and PEPE slips
Open Interest (OI) refers to the value of all active futures and options contracts of a cryptocurrency. A decline in OI translates to investors withdrawing capital as uncertainty increases.
CoinGlass data shows the open interests of the dog-themed coins DOGE and SHIB are down by over 2%, holding at $3.58 billion and $182.98 million, respectively. Meanwhile, the frog-themed meme coin, Pepe’s OI, is down by over 7%, standing at $596.26 million.

Open interests. Source: Coinglass
This sharp outflow of funds from the meme coins’ derivatives signals a risk-off sentiment among investors, opting for a wait-and-see approach.
Dogecoin is at risk of a triangle pattern meltdown
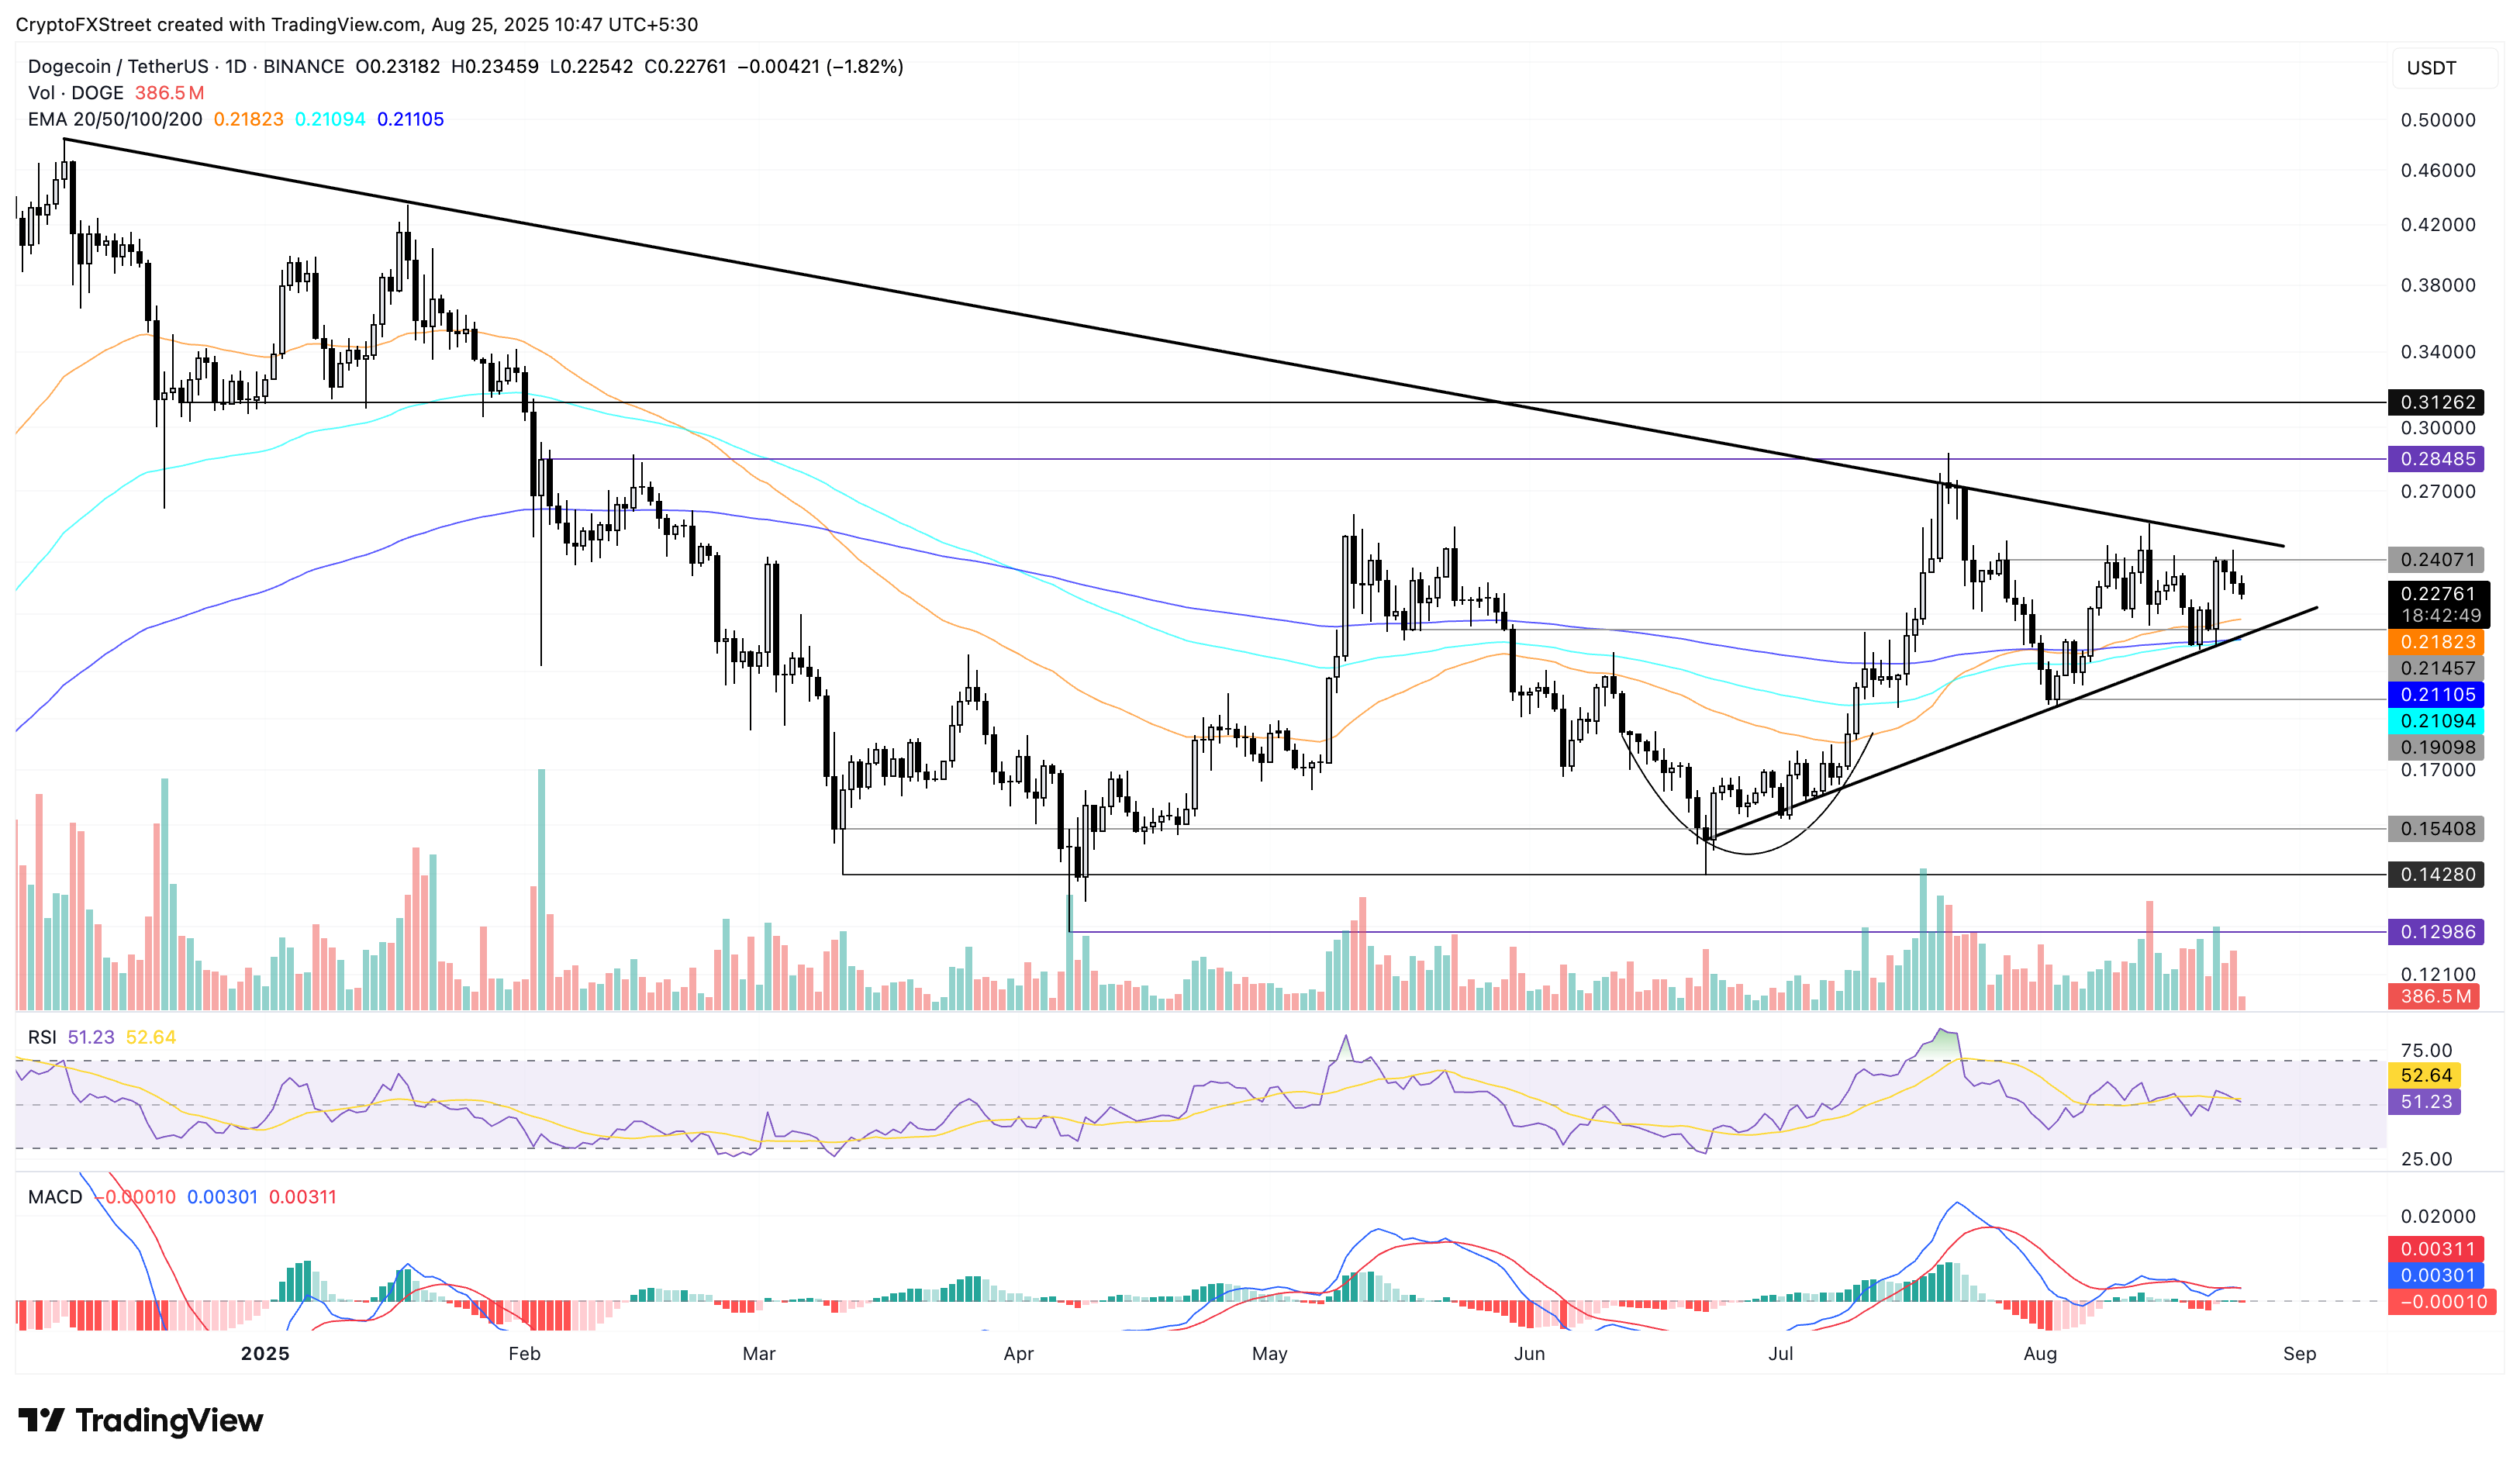
Dogecoin edges lower by nearly 2% at press time on Monday, extending the downtrend for the third consecutive day. The largest meme coin by market capitalization, with a value of $35.00 billion, is currently undergoing a downcycle within a symmetrical triangle pattern, as shown on the daily chart (shared below).
Dogecoin eyes the 50-day Exponential Moving Average (EMA) at $0.2182, slightly above the triangle pattern’s lower boundary. A potential decisive close below this boundary line at $0.2115, close to the 200-day EMA, would mark a bearish outcome, potentially extending the decline to $0.1909, as seen on August 2.
The momentum indicators remain neutral as the Moving Average Convergence Divergence (MACD) and its signal line move flat with mixed signals on the daily chart. Additionally, the Relative Strength Index (RSI) reads 51 on the same chart, indicating a downside move towards the midpoint line.
DOGE/USDT daily price chart.
Optimistically, a potential close above the $0.2407 level would increase the upside breakout chances of the triangle pattern. This could result in an uptrend stretching to the $0.2848 level, last tested on July 21.
Shiba Inu eyes further losses
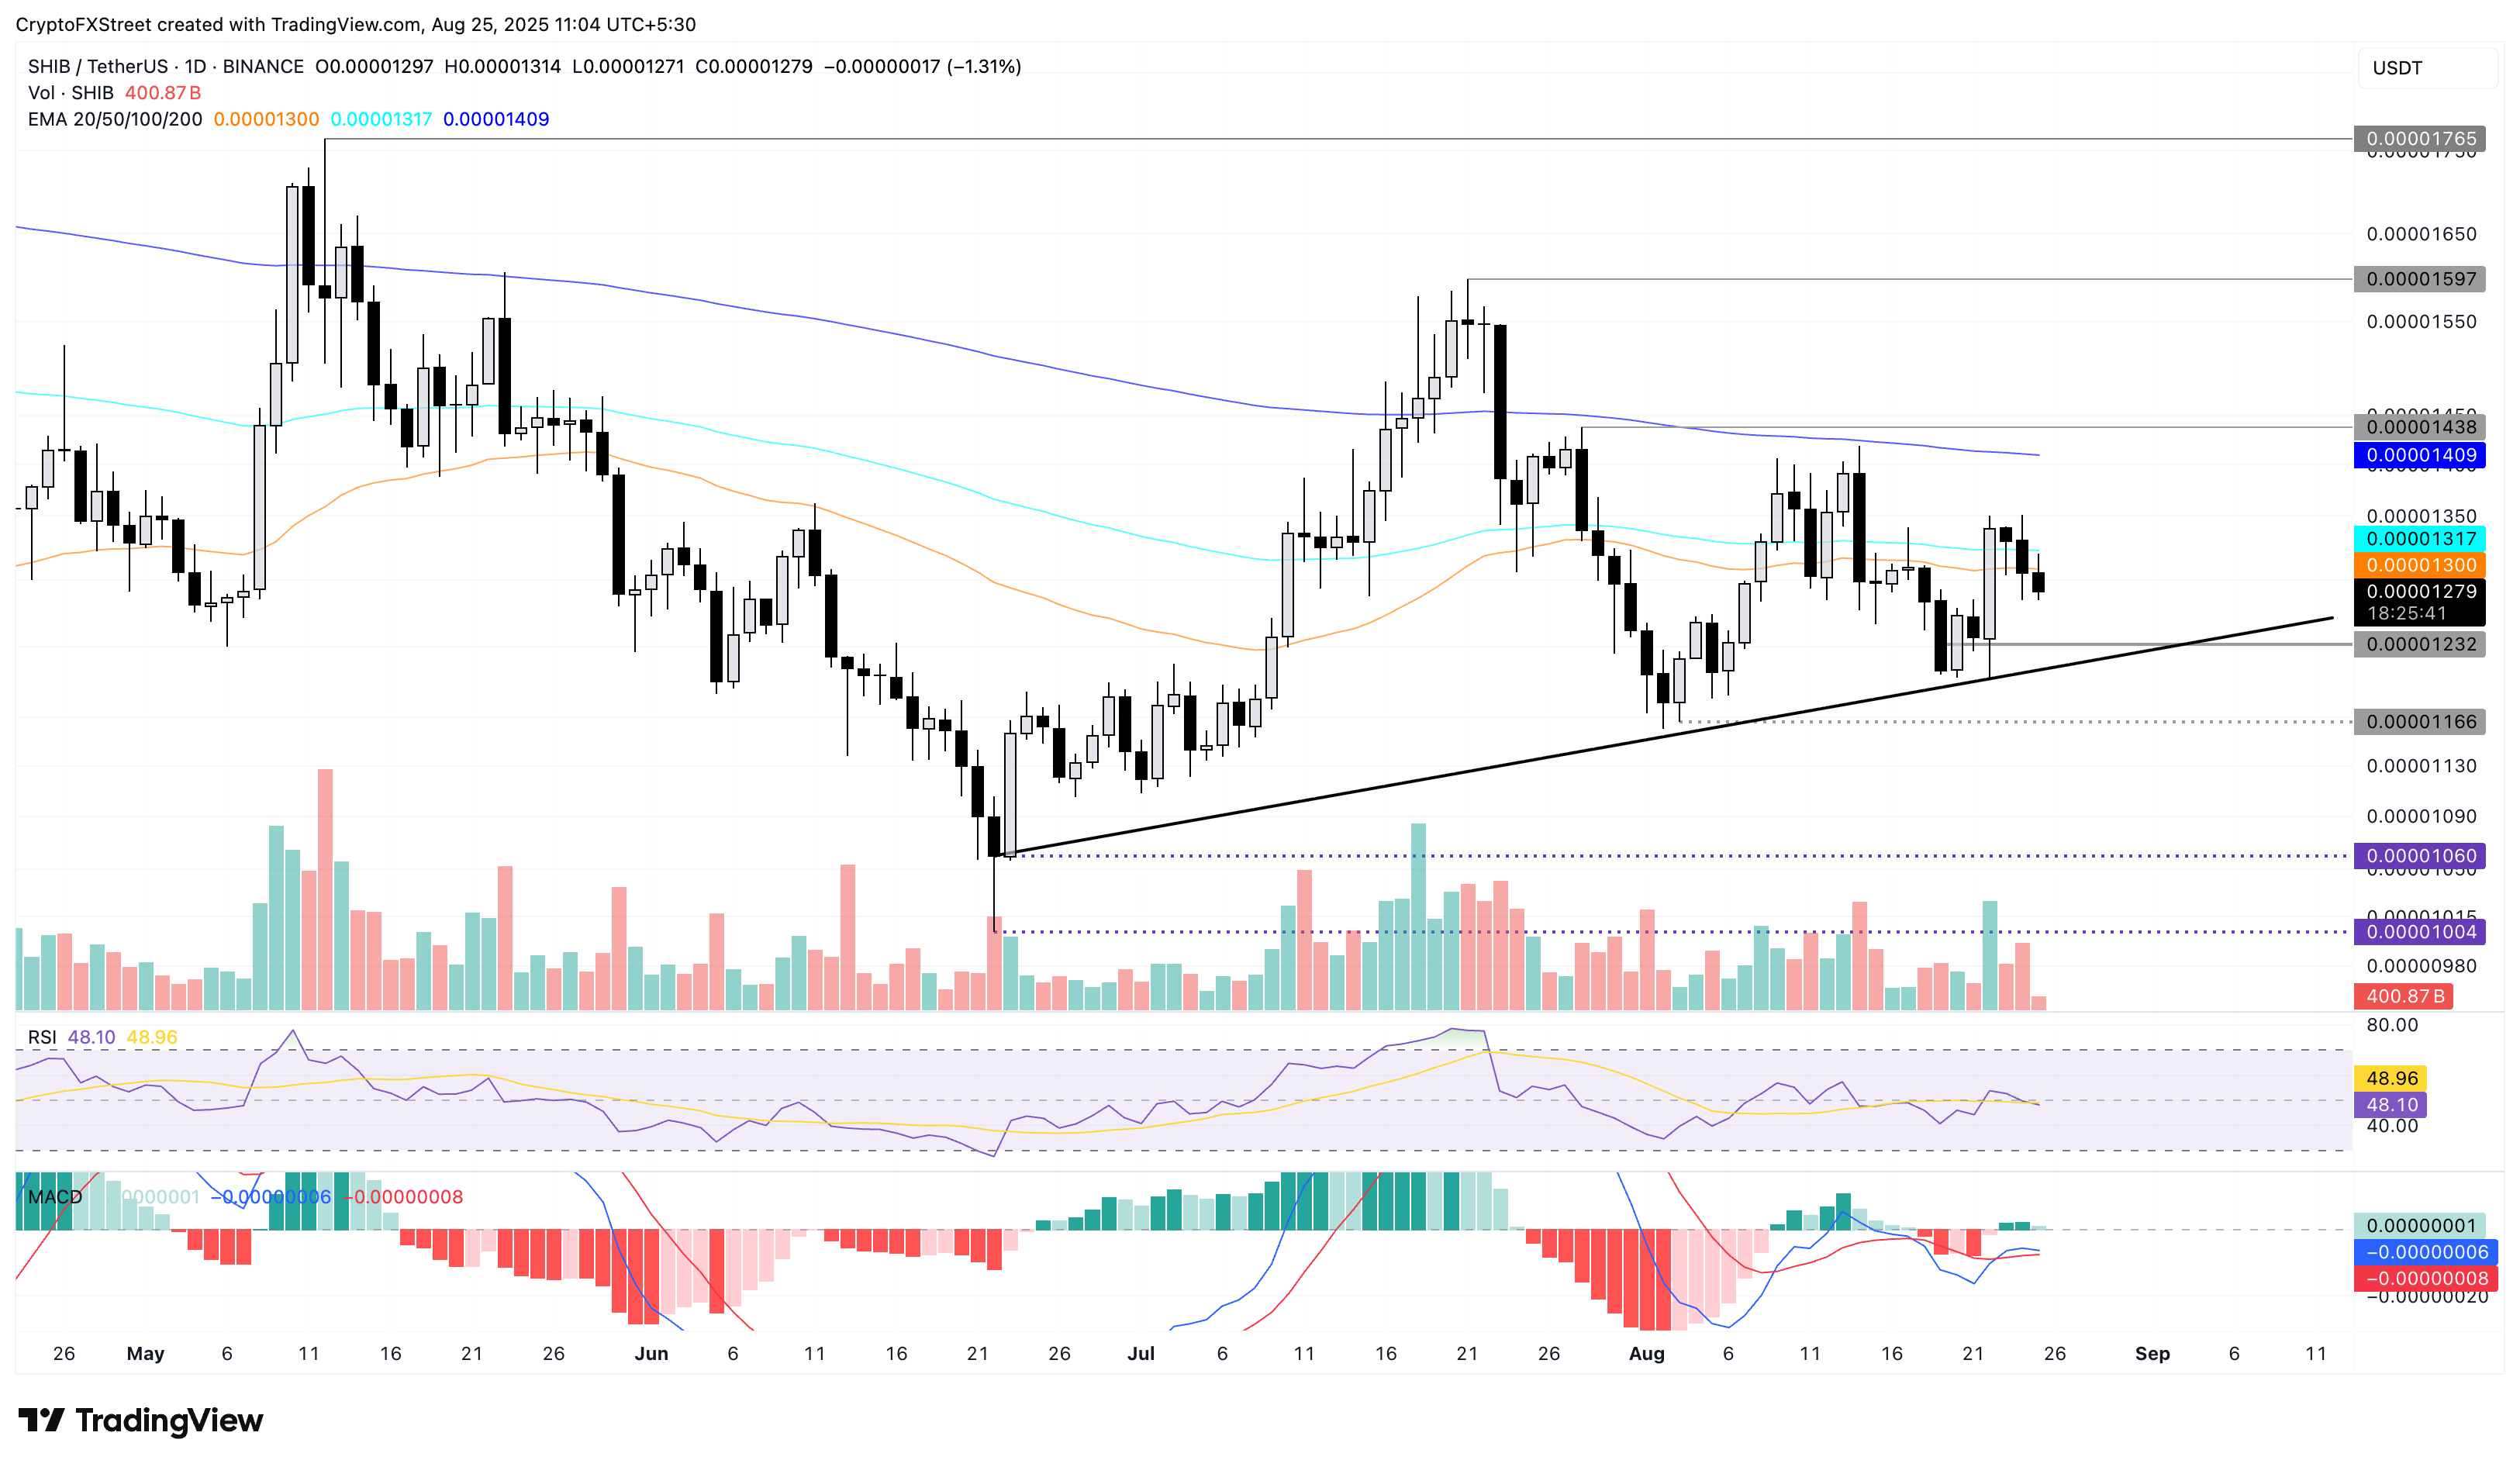
Shiba Inu slips below the 50-day EMA with an intraday pullback of over 1% so far on the day, extending the 2.26% loss from Sunday. SHIB has lost over 50% of the gains from Saturday, targeting a local support trendline near the $0.00001200 round figure.
The momentum indicators suggest a shift to neutral levels as the MACD and its signal line converge, potentially leading to a crossover that could reinstate a declining trend. Additionally, the RSI at 48 slopes downwards below the halfway line, suggesting a decrease in buying pressure.
SHIB/USDT daily price chart.
Still, a potential bounce back above the 50-day EMA at $0.00001300 could rebound SHIB towards the 200-day EMA at $0.00001409.
Pepe risks losing a crucial psychological level
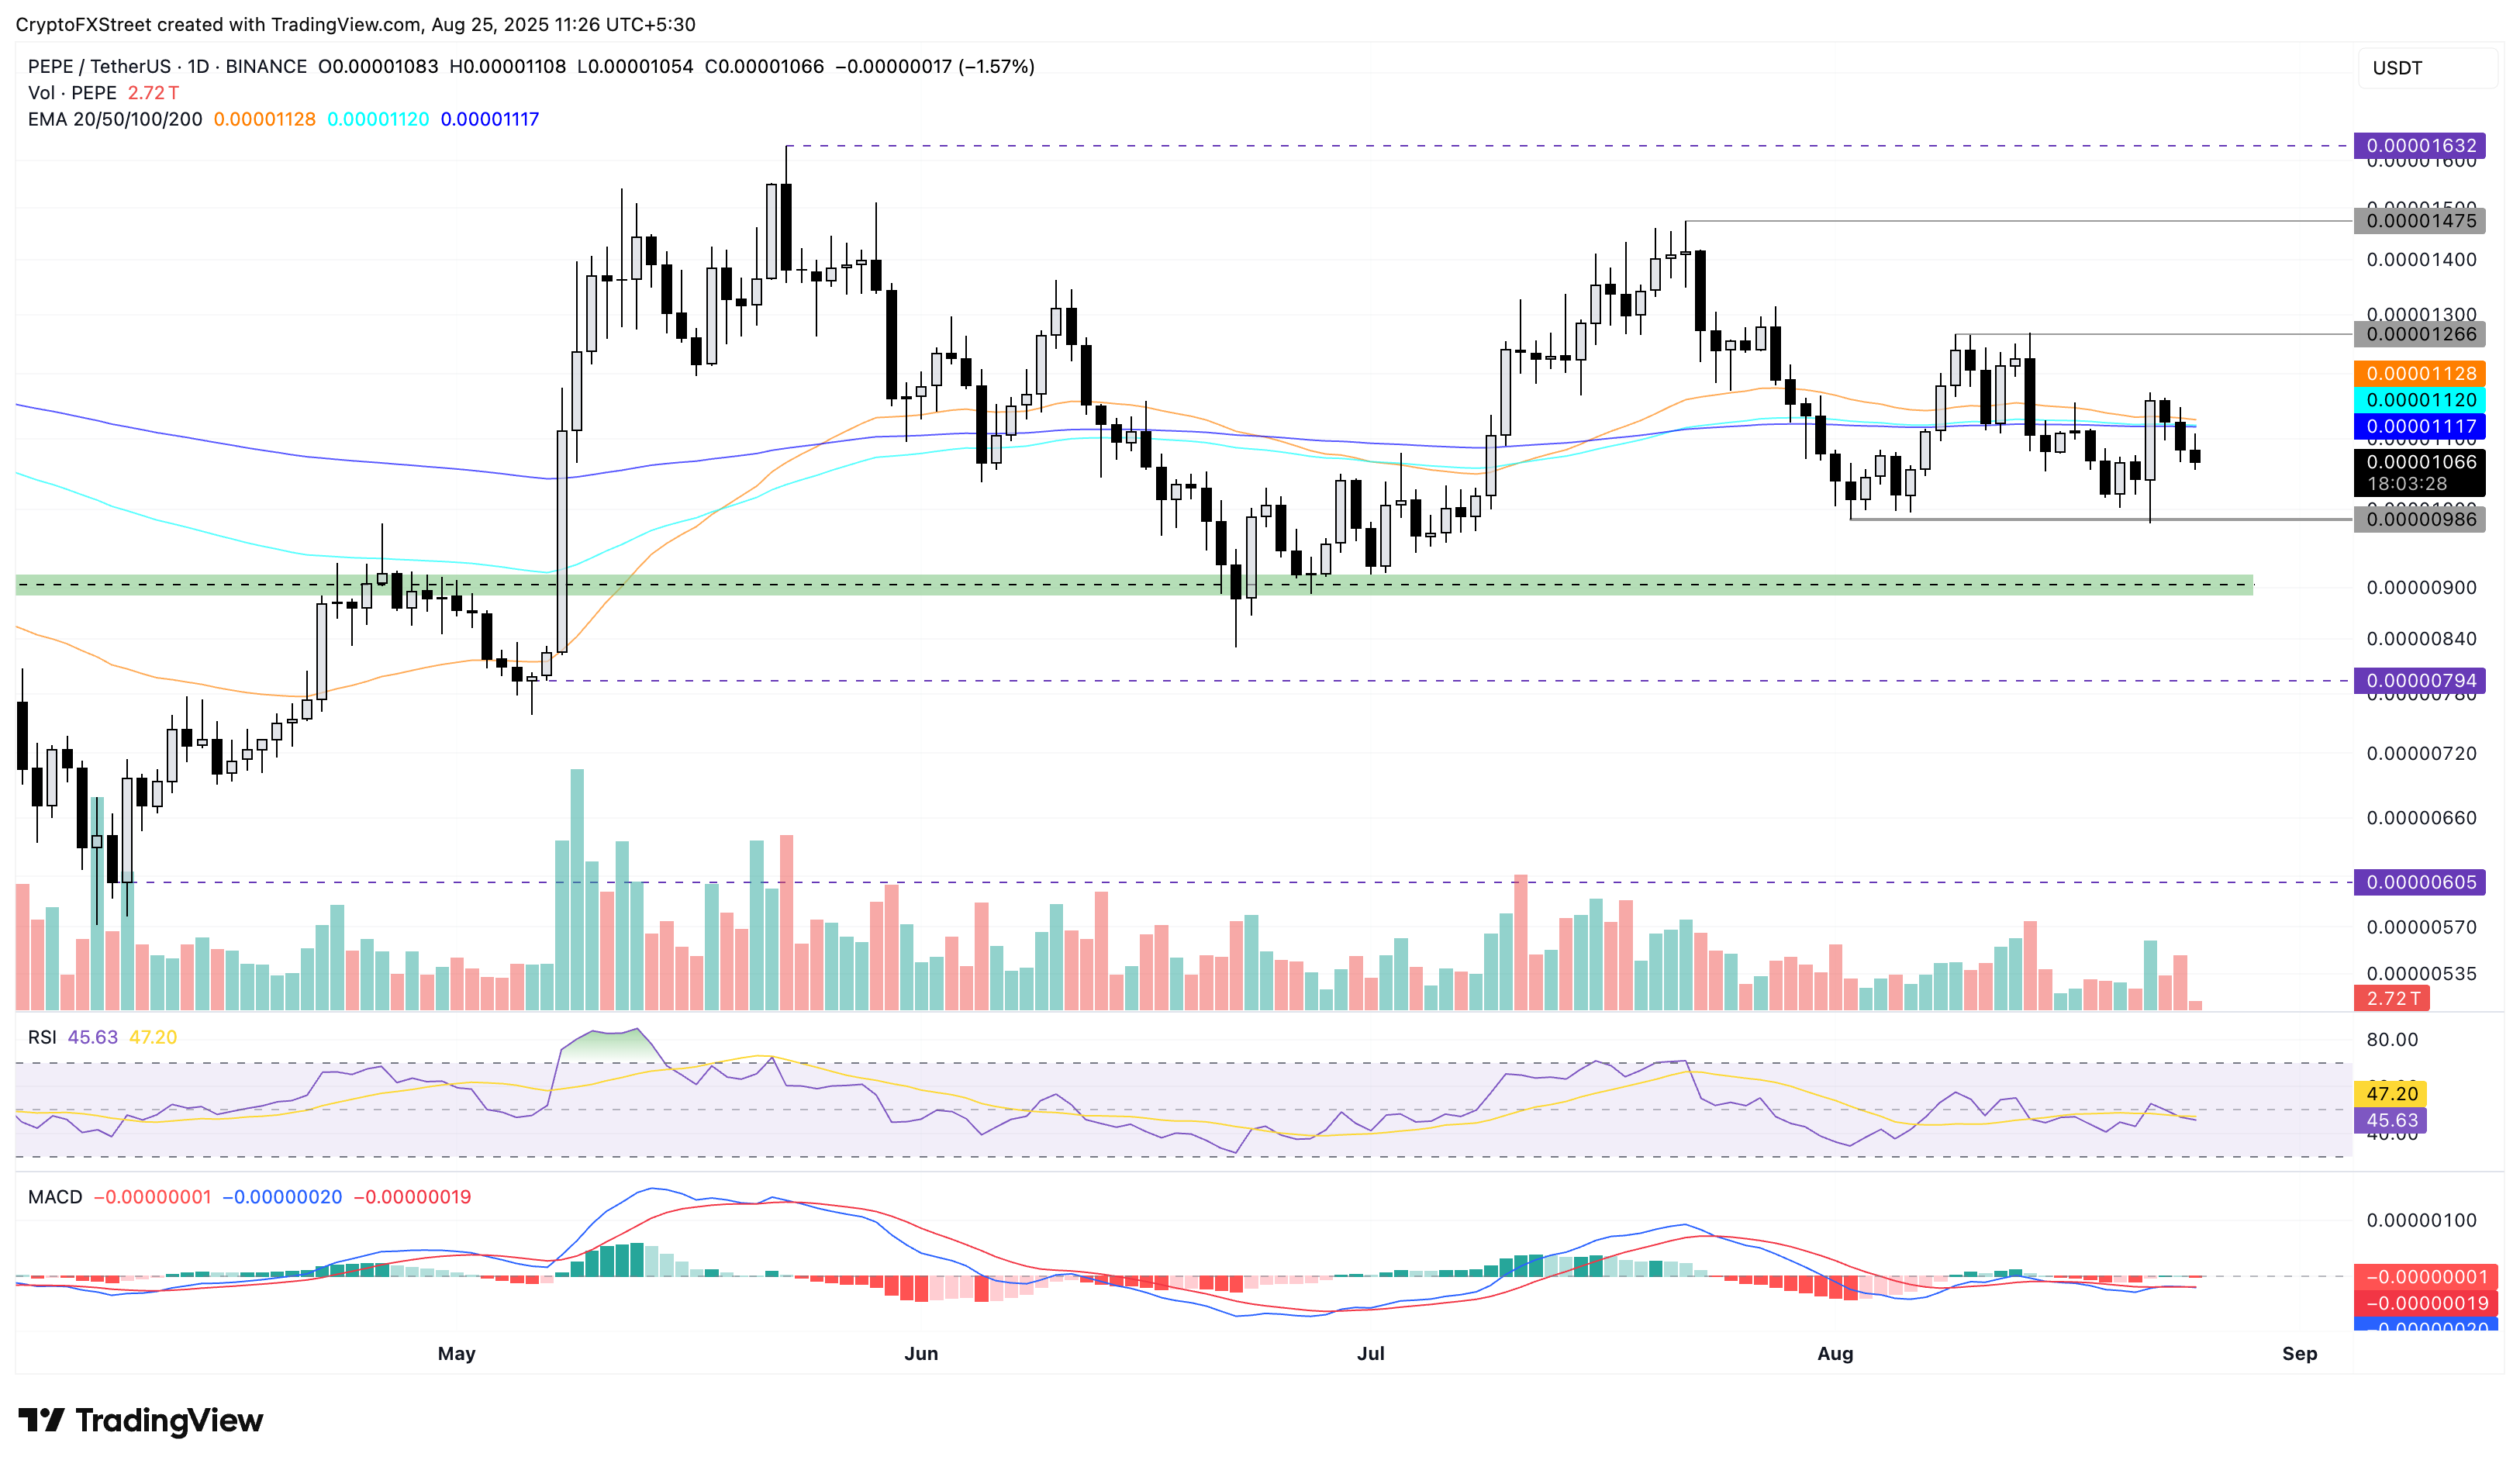
Similar to DOGE and SHIB, Pepe edges lower for the third consecutive day by over 1% at press time on Monday. The declining trend increases the chances of a Death Cross pattern between the 50- and 200-day EMAs.
PEPE targets the $0.00000986 level, putting the $0.00001000 psychological level at risk. A clean push below this level could test the $0.00000900 support zone, marked by a green band on the daily chart (shared below).
The RSI reads 45 on the same chart, indicating a downward trend as selling pressure increases. It also indicates that there is room for further correction before reaching oversold conditions.
The MACD indicator displays the merged average lines moving flat in the negative territory, reflecting a rising bearish influence.
PEPE/USDT daily price chart.
Looking up, if PEPE rebounds to cross above the 200-day EMA at $0.00001117, the bulls could challenge the $0.00001266 level.
Recommended Articles












Comments (0)
Click the $ button, enter the symbol, and select to link a stock, ETF, or other ticker.