


Solana-based Crypto: Bonk, Pudgy Penguins, SPX6900 brace for further recovery as bearish momentum fades



- BONK edges higher by 4% extending the Sunday gains, which formed a morning star pattern.
- PENGU hints at a short-term reversal as bearish momentum declines.
- SPX meme coin bounces off within a rising wedge, eyeing further gains.
The broader cryptocurrency market begins the week on a bullish note, with meme coins based on the Solana (SOL) blockchain poised for a trend reversal. Bonk (BONK), Pudgy Penguins (PENGU), and SPX6900 (SPX) edge higher to extend the Sunday gains as bearish momentum fades.
BONK’s recovery marks a shift in trend momentum
BONK edges higher by over 4% at press time on Monday, extending the nearly 5% gains from Sunday. The reversal run in BONK holds dominance above the 50% retracement level at $0.00002350, drawn from $0.00006230 on November 20 to $0.00000886 on April 7, targeting the 61.8% Fibonacci level at $0.00002958.
A decisive close above $0.00002958 could extend the bullish run to $0.00004105 level, aligning with the 78.6% Fibonacci level.
The technical indicators signal a shift in momentum as the Relative Strength Index (RSI) reads 47 on the daily chart, holding at neutral levels with an uptick. Meanwhile, the Moving Average Convergence Divergence (MACD) edges higher towards its signal line amid declining red bars, suggesting a decrease in bearish momentum.
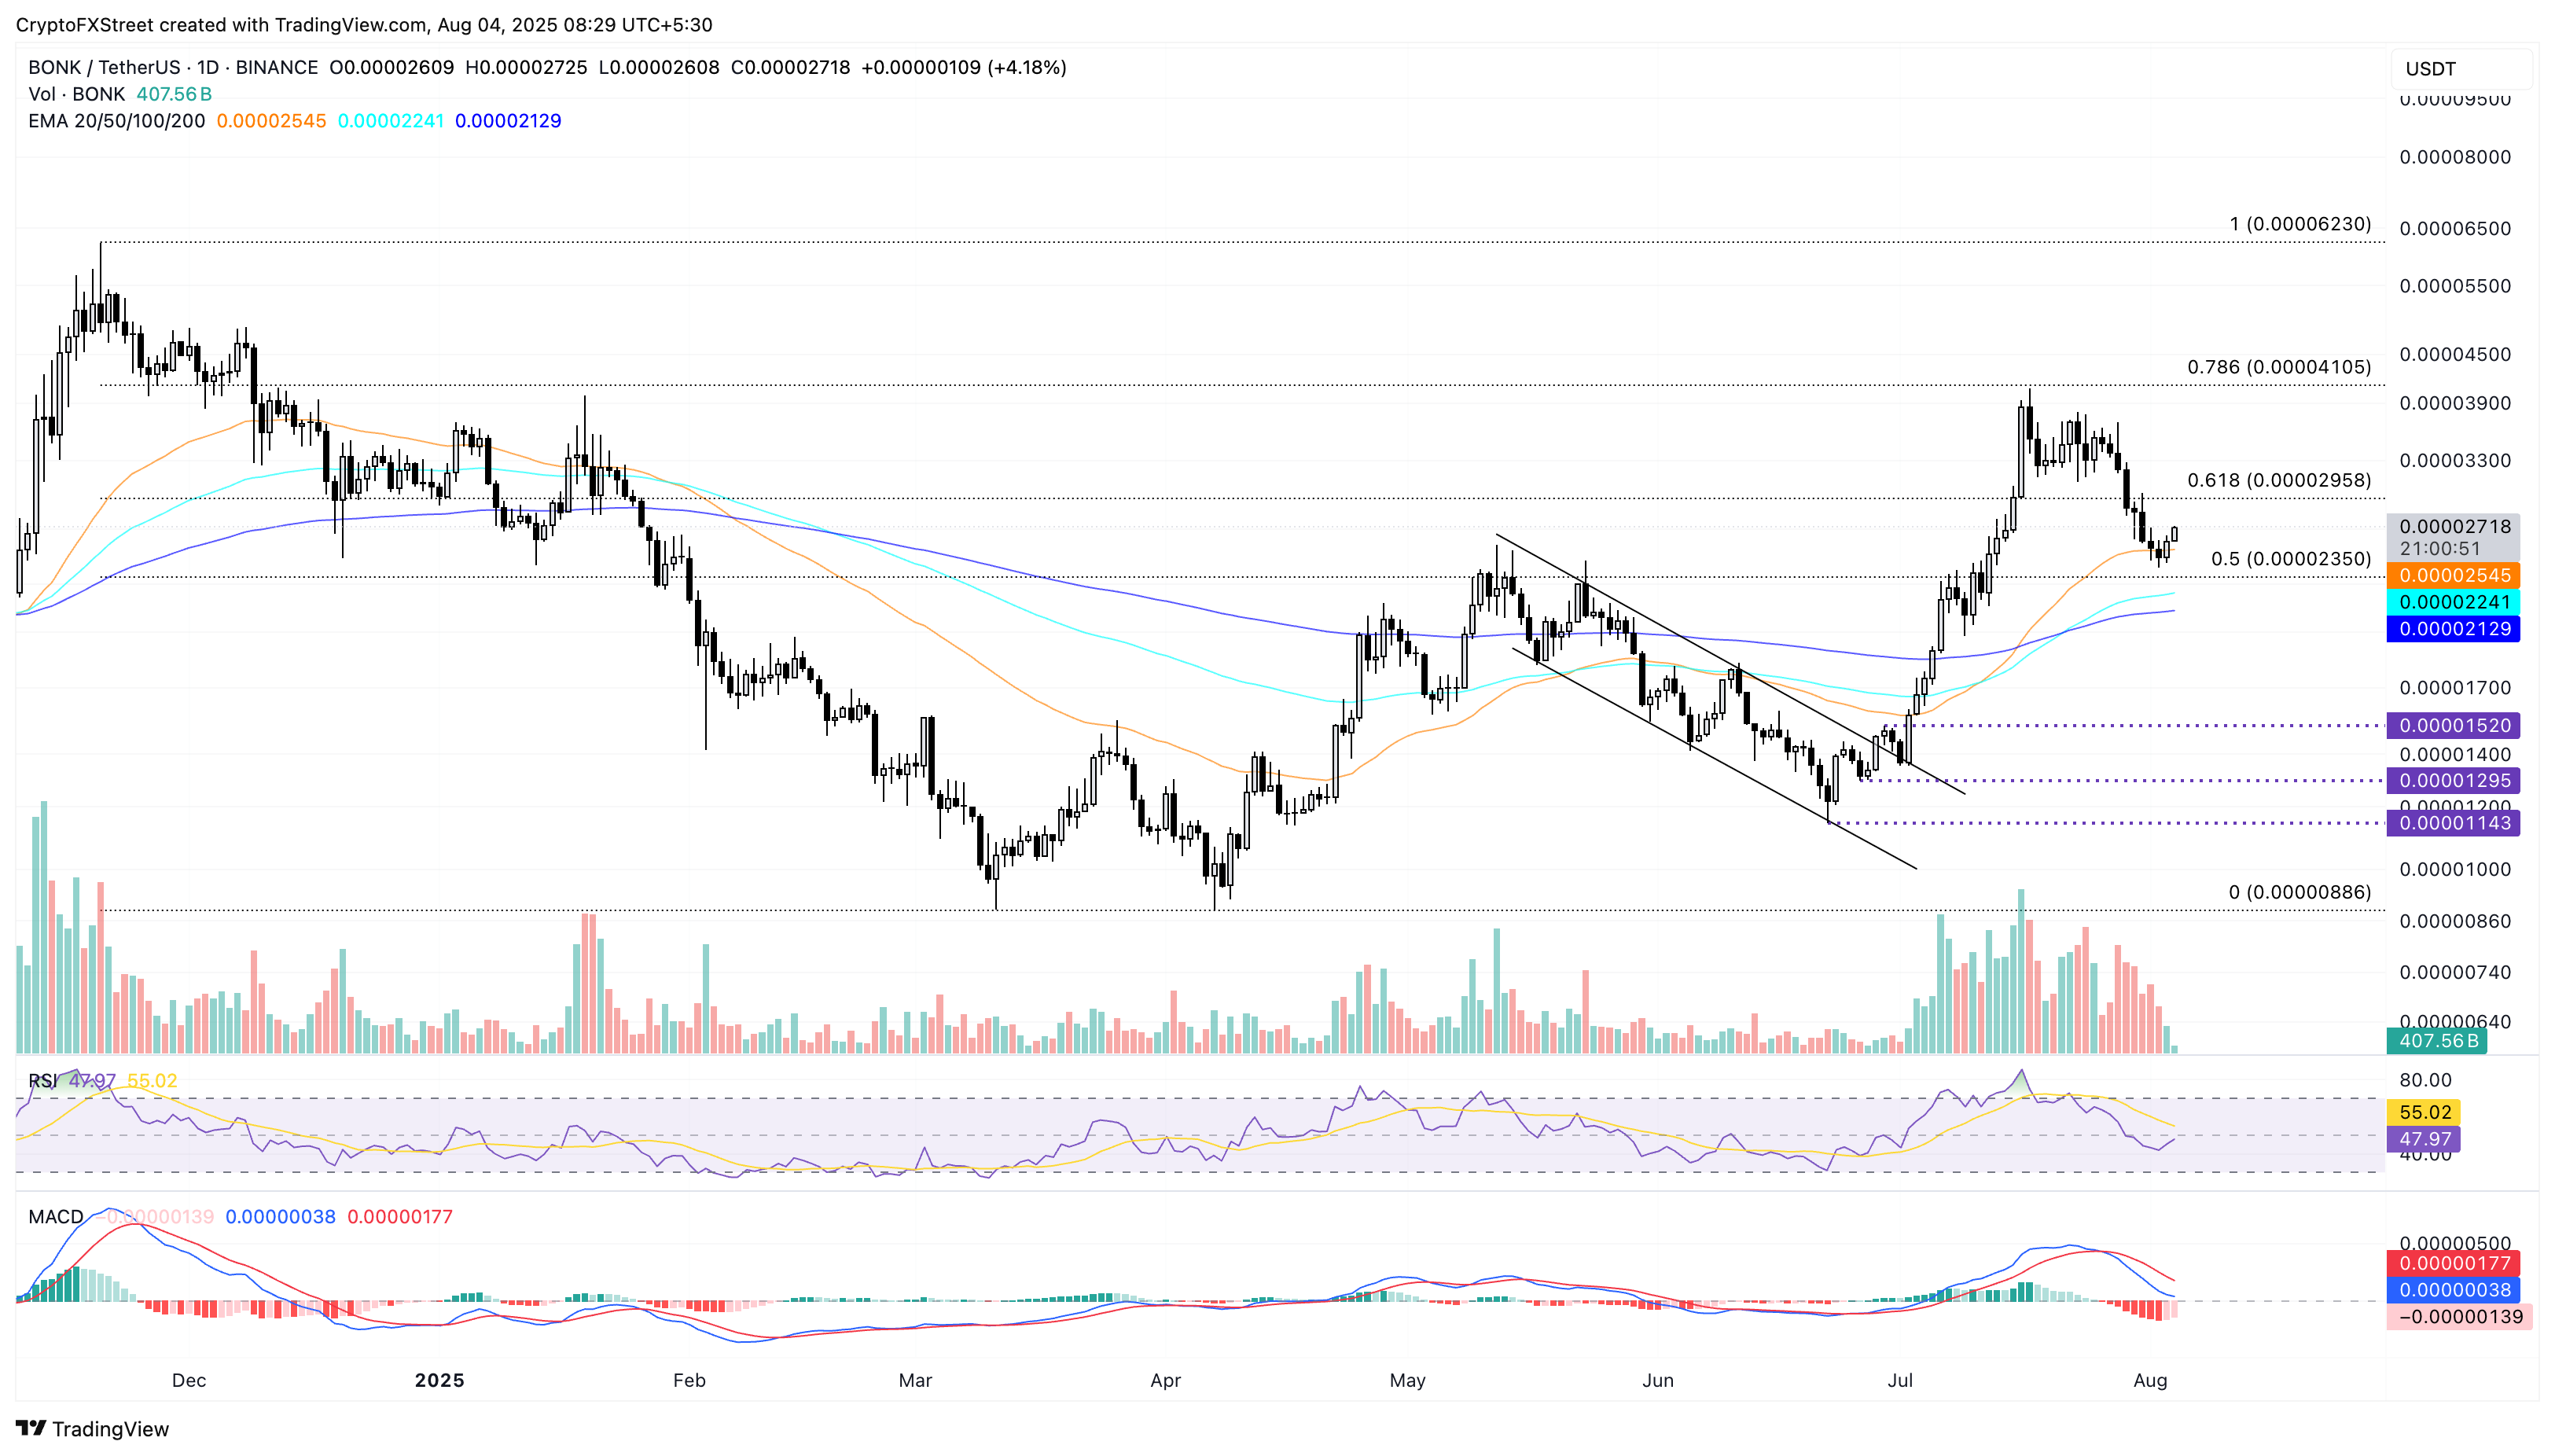
BONK/USDT daily price chart.
Still, a clean push in the Solana-based meme coin below the 50% retracement level at $0.00002350 could retest the 200-day Exponential Moving Average (EMA) at $0.00002129.
PENGU targets the previous week’s high amid fading bearish momentum
PENGU recorded a 6% surge on Sunday, hinting at a potential reversal from the pullback seen at the start of last week. The Solana-based meme coin edges higher by over 2% at the time of writing on Monday, nearing the 78.6% Fibonacci level at $0.03713, retraced between $0.07000 on December 17 and $0.00370 on April 9.
Investors could consider a decisive close above this level as a buy signal, targeting the previous week's high at $0.04660.
The RSI reads 58 on the daily chart as it bounces off the neutral levels, while the declining trend in the MACD and average lines slows down as the red bars decrease.
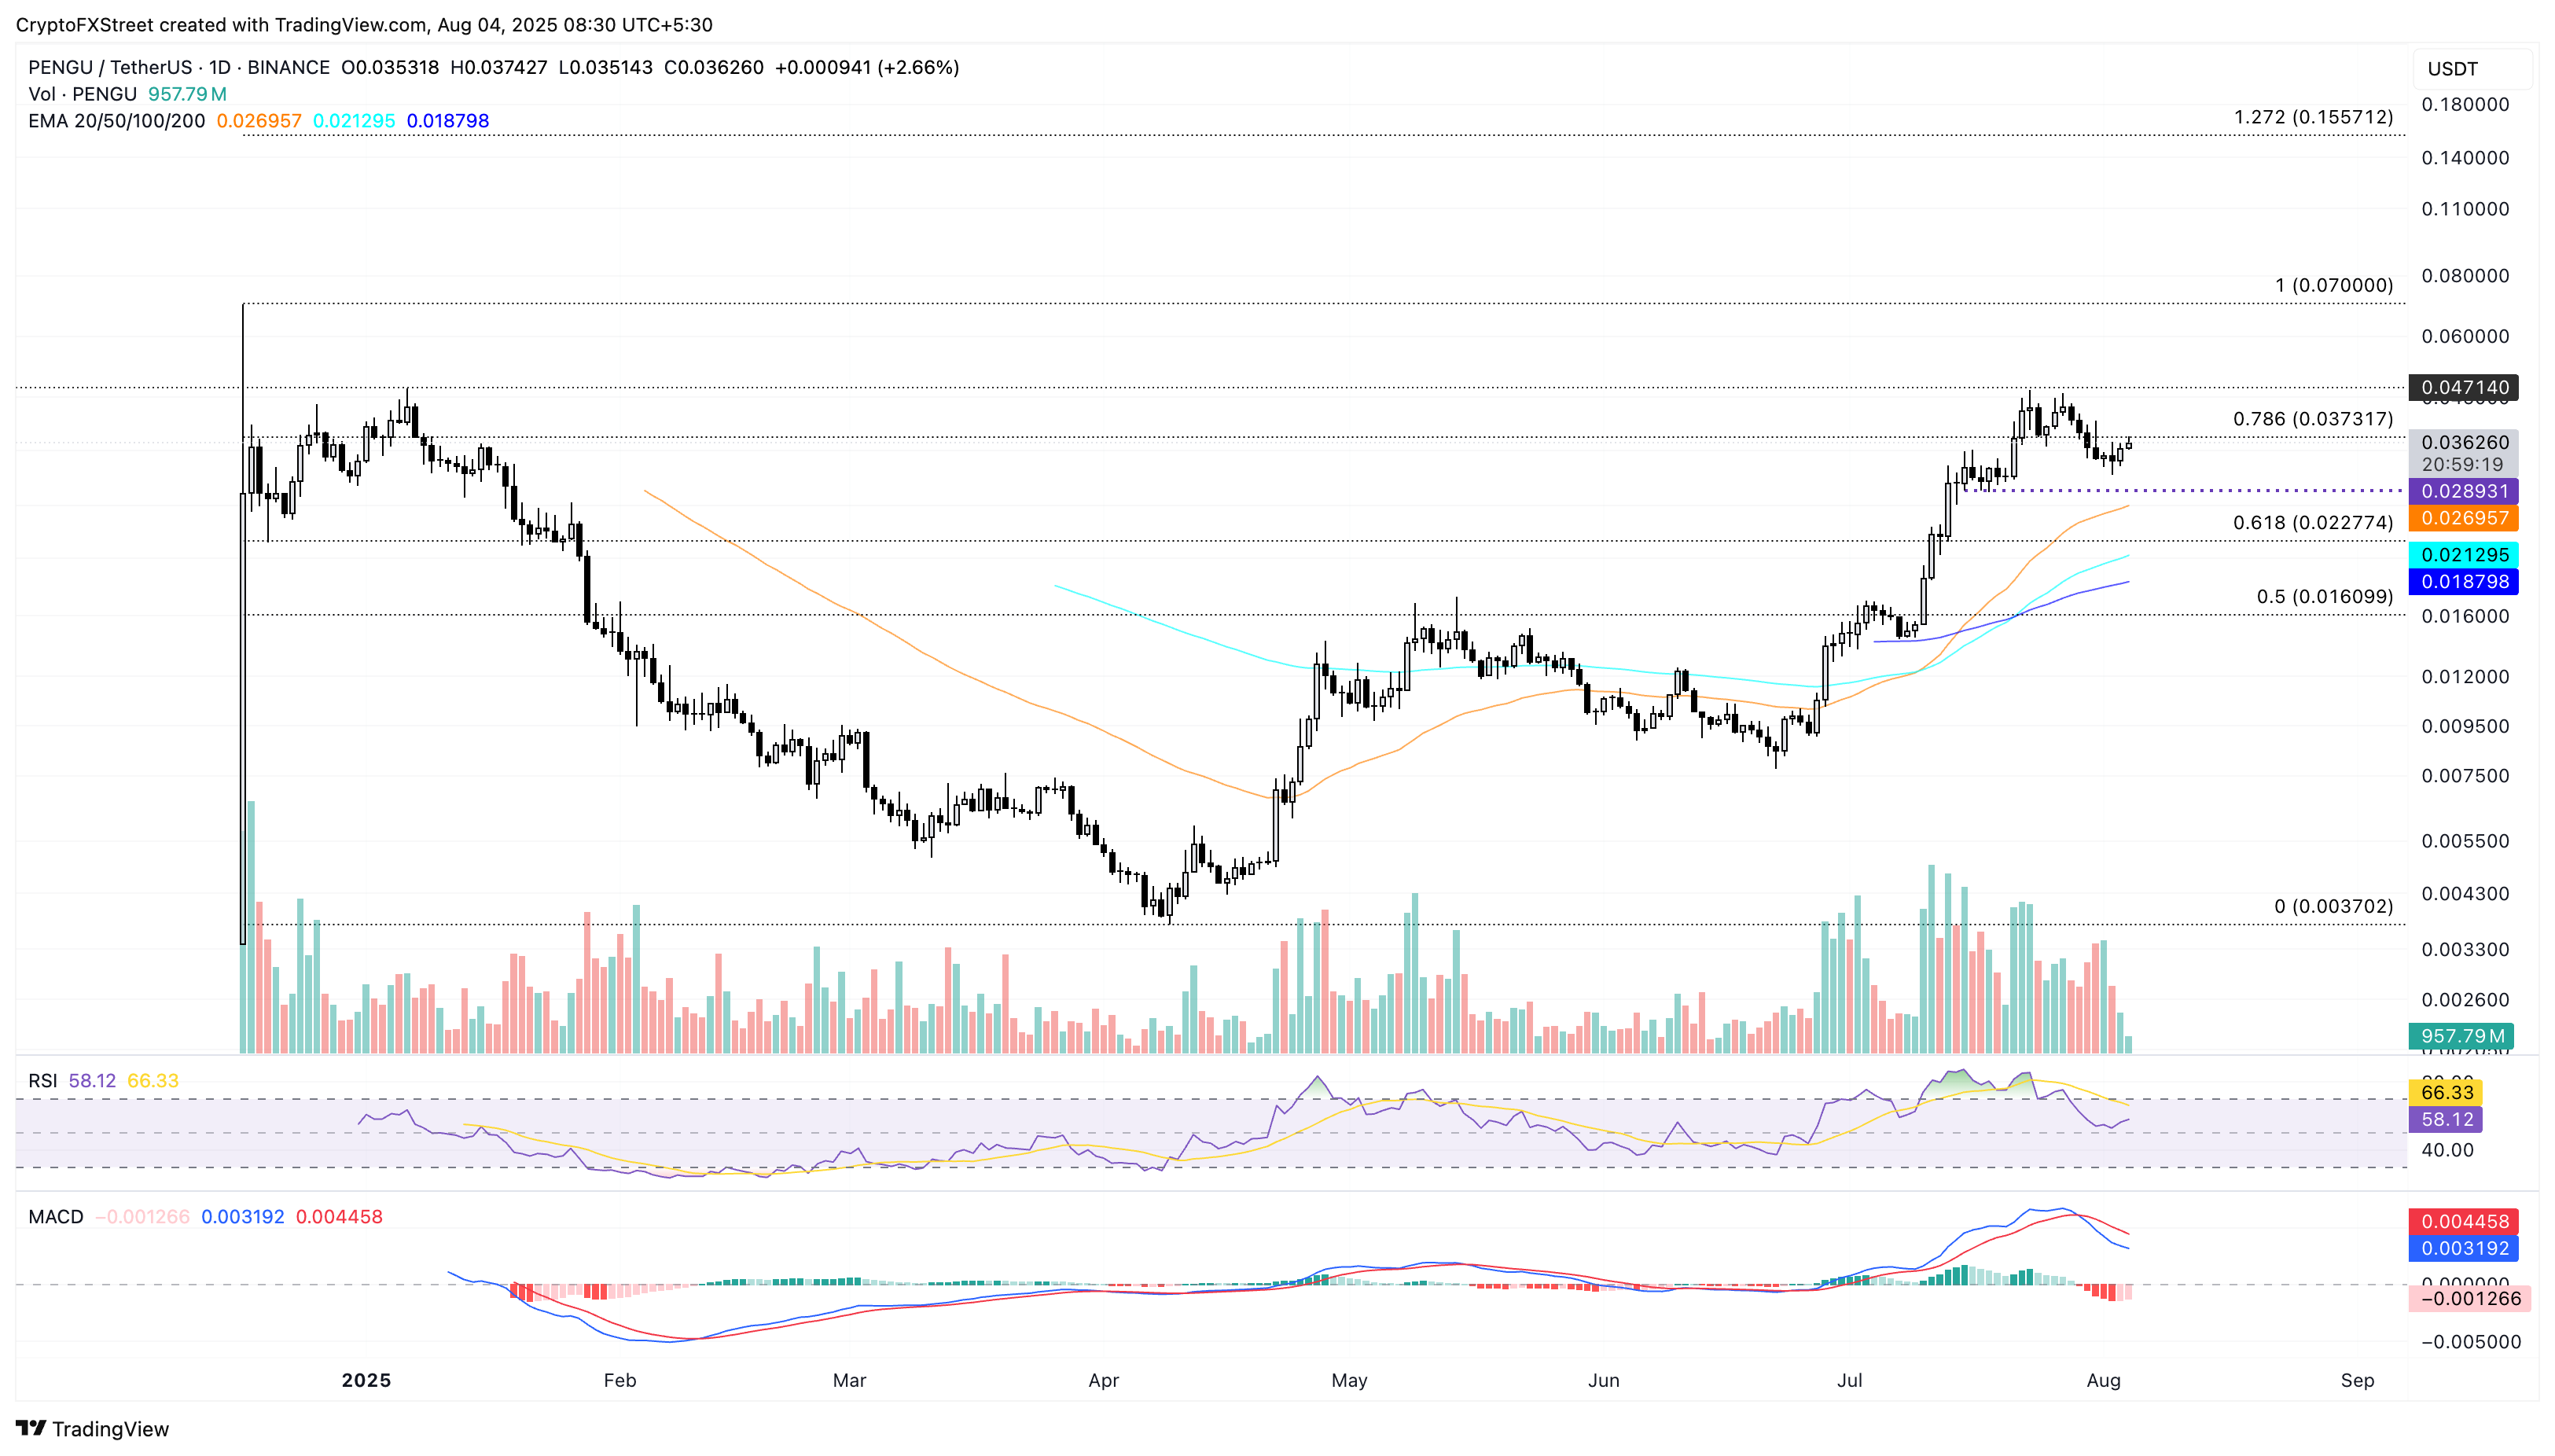
PENGU/USDT daily price chart.
On the downside, a reversal in PENGU could test the $0.02893 support level marked by the low on July 15.
SPX eyes further gains within a rising wedge pattern
SPX6900 recorded a 7.50% jump on Sunday and edged higher by nearly 2% at press time on Monday. The Solana-based meme coin bounces off a local support trendline formed connecting the lows of May 17 and June 21 on Saturday, with bulls targeting the previous week’s high at $2.28.
It is worth noting that the price action forms a rising wedge pattern with the above-mentioned support trendline and a resistance trendline formed by February 14 and June 11 peaks.
The technical indicators suggest a decline in bearish momentum as the red bars decrease in the MACD indicator and the RSI reads 47, reaching neutral levels with a bounce back.
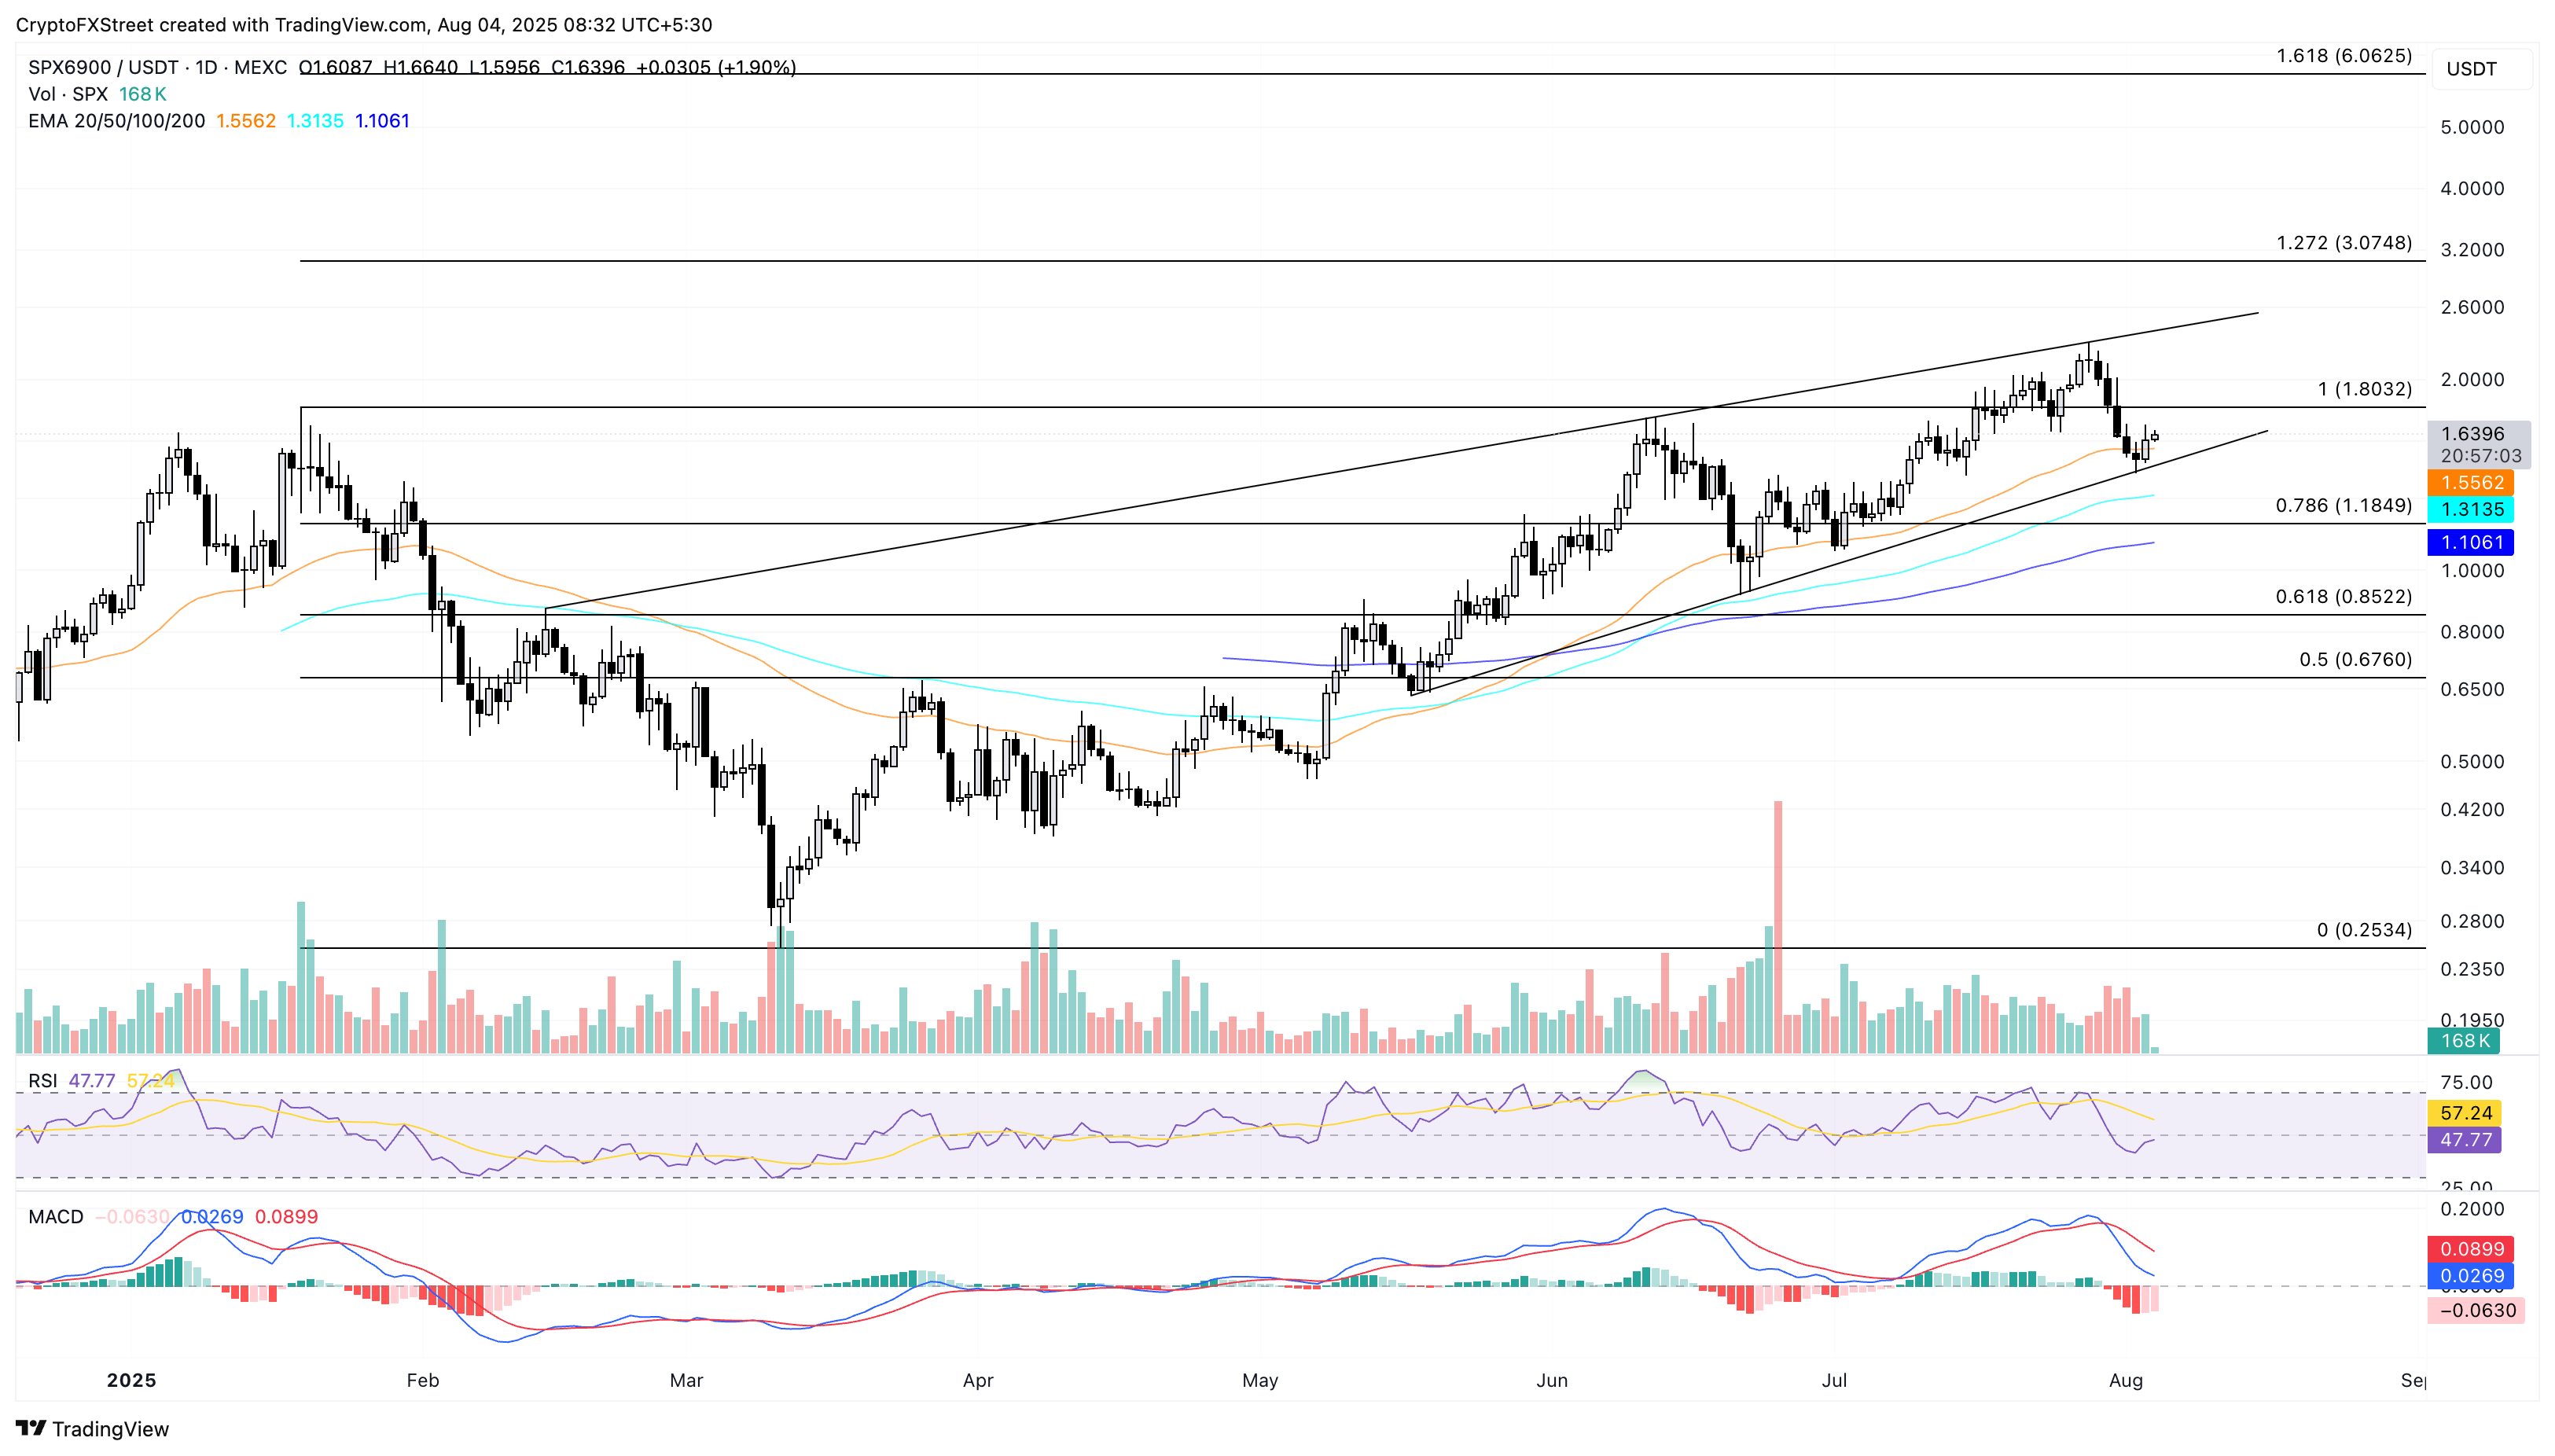
SPX/USDT daily price chart.
On the contrary, a pullback in SPX under the support trendline near $1.48 could test the 100-day EMA at $1.31.
Recommended Articles










Comments (0)
Click the $ button, enter the symbol, and select to link a stock, ETF, or other ticker.