


 Discount


Amphenol Corp Stock (APH) Moved Down by 7.79% on Nov 20: Drivers Behind the Movement


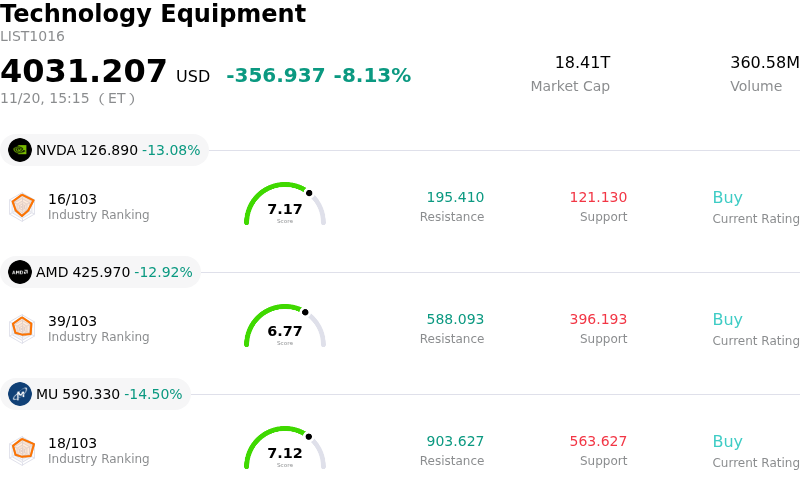
Amphenol Corp (APH) moved down by 7.79%. The Technology Equipment sector is down by 8.13%. The company outperformed the industry. Top 3 stocks by turnover in the sector: NVIDIA Corp (NVDA) down 13.15%; Advanced Micro Devices Inc (AMD) down 12.93%; Micron Technology Inc (MU) down 14.41%.
What is driving Amphenol Corp (APH)’s stock price down today?
Amphenol Corporation faced sharp downward pressure during the trading session, driven primarily by a broad rotation out of premium-valued hardware technology and interconnect suppliers. As an integral component provider to hyperscale artificial intelligence clusters and enterprise data centers, the company is particularly sensitive to shifts in institutional risk appetite regarding the pace and sustainability of next-generation digital infrastructure capital expenditures. Broad-based weakness across server component ecosystems and semiconductor supply chains catalyzed widespread profit-taking among institutional holders.
Compounding the session's pullback are intensified market debates over the deployment cadence of high-density AI server architectures. While Amphenol maintains a commanding market share in advanced high-speed copper backplanes, cabling assemblies, and optical interconnects, periodic investor anxiety regarding channel inventory digestion and future optical architectural transitions frequently triggers outsized volatility in high-multiple hardware providers. Any perceived air pocket or delayed transition in cloud provider procurement schedules tends to compress forward multiples across the advanced connector peer group.
Beyond data communications, broader macroeconomic and institutional dynamics reinforced the selloff. Fluctuations in bond yields and rising volatility across major equity benchmarks prompted systematic funds and multi-asset asset allocators to reduce exposure to cyclical electronics and industrial tech leaders. Because Amphenol has historically traded at a premium multiple relative to traditional industrial peers due to its exposure to secular technology megatrends, it remains vulnerable to accelerated liquidations during risk-off sessions.
Looking ahead, market participants will focus heavily on upcoming order booking trends across IT datacom, automotive electrification, and defense segments to assess underlying demand health. Long-term institutional investors will seek validation that hyperscaler demand for next-generation interconnect architectures remains durable, watching for operational margin resilience and organic revenue stability to signal an end to the current valuation reset.
Technical Analysis of Amphenol Corp (APH)
Technically, Amphenol Corp (APH) shows a MACD (12,26,9) value of -1.109, indicating a sell signal. The RSI at 35.644 suggests neutral condition and the Williams %R at 98.515 suggests oversold condition. Please monitor closely.
Fundamental Analysis of Amphenol Corp (APH)
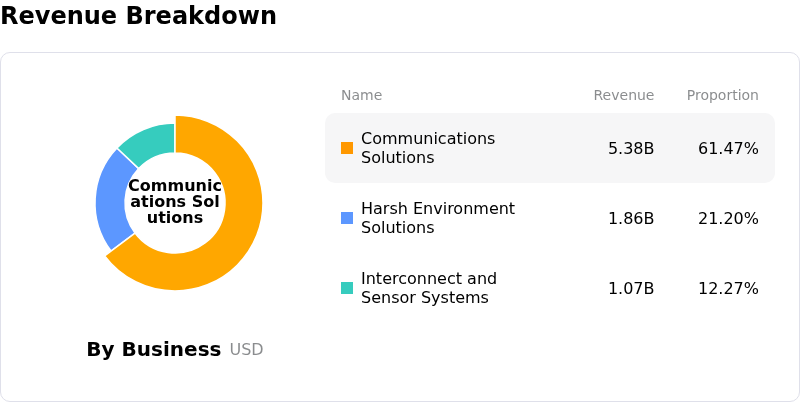
Amphenol Corp (APH) is in the Technology Equipment industry. Its latest annual revenue is $23.09B, ranking 4 in the industry. The net profit is $4.27B, ranking 1 in the industry. Company Profile
Over the past month, multiple analysts have rated the company as Buy, with an average price target of $106.55, a high of $130.00, and a low of $85.00.
More details about Amphenol Corp (APH)
Company Specific Risks:
- AI Infrastructure and Datacom Capex Concentration: With the IT Datacom segment generating nearly half of total corporate sales and approximately 75% of those revenues heavily concentrated in artificial intelligence interconnect architectures, Amphenol is acutely exposed to any hyperscaler capital expenditure slowdown or component digestion cycles, driving steep intraday declines alongside tech-hardware volatility [PerQueryResult(index="1.1.2", index="1.1.4")].
- Severe Valuation Premium and Multiple Compression: Trading at an elevated price-to-earnings multiple substantially above its five-year historical baseline, Amphenol leaves little margin for execution error, rendering the stock highly vulnerable to abrupt intraday institutional profit-taking and quantitative stop-loss cascades during sector-wide de-risking [PerQueryResult(index="1.1.1", index="1.1.4")].
- M&A Integration Friction and Leverage Burden: Heavy serial acquisition activity—including large-scale asset integrations such as CommScope's connectivity businesses that pushed total debt to roughly $17.87 billion—exposes the company to near-term operating margin dilution, transaction friction, and rising capital-servicing costs [PerQueryResult(index="1.1.1", index="1.1.2", index="1.1.5")].
- High-Profile Executive Insider Divestment: Sentiment has been unsettled by sizable insider disposals, highlighted by CEO Adam Norwitt's Form 144 filing and subsequent liquidation of roughly $66 million in equity, which institutional desks interpret as cautionary profit-taking that compounds downside intraday selling pressure [PerQueryResult(index="1.1.1", index="1.1.2")].
This article may include AI-generated content that is human-reviewed, which is for reference and general information purposes only and does not constitute investment advice.
Recommended Articles





Comments (0)
Click the $ button, enter the symbol, and select to link a stock, ETF, or other ticker.