


 Discount


Newmont Corporation Stock (NEM) Moved Down by 5.89% on Nov 18: Drivers Behind the Movement


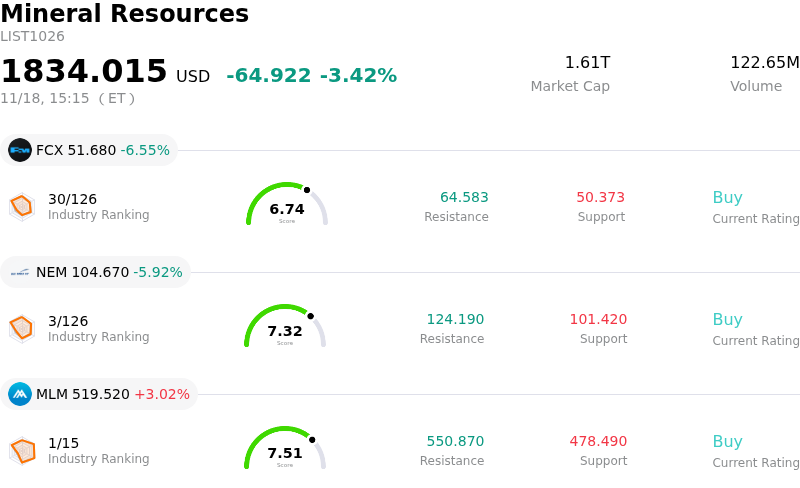
Newmont Corporation (NEM) moved down by 5.89%. The Mineral Resources sector is down by 3.42%. The company underperformed the industry. Top 3 stocks by turnover in the sector: Freeport-McMoRan Inc (FCX) down 6.69%; Newmont Corporation (NEM) down 5.92%; Martin Marietta Materials Inc (MLM) up 3.02%.
What is driving Newmont Corporation (NEM)’s stock price down today?
Newmont Corporation experienced notable downward pressure during the session, driven primarily by a sharp retreat in underlying precious metal prices alongside broader macroeconomic headwinds affecting capital-intensive miners. Because senior gold producers exhibit substantial operational leverage relative to physical bullion, any swift downward repricing in spot gold typically results in magnified selling pressure across mining equities.
A primary catalyst for the pullback stems from macro-driven headwinds in currency and bond markets. A resurgent U.S. dollar, paired with rising benchmark Treasury yields, diminishes the investment appeal of non-yielding assets such as gold. When expectations surrounding central bank monetary policy lean hawkish or signal prolonged elevated interest rates, institutional allocators tend to reduce exposure to precious metal hedges. For Newmont, whose top-line trajectory and margin expansion are directly tethered to realized gold pricing, these macro dynamics trigger immediate valuation compression.
In addition to commodity headwinds, investor scrutiny remains elevated regarding the cost structures of major miners. Industry-wide inflationary pressures in labor, energy, and key processing inputs have kept all-in sustaining costs elevated across global operations. When gold prices soften even modestly, market participants rapidly recalculate free cash flow generation and margin durability, especially for producers managing large-scale asset integration and extensive sustaining capital expenditure programs. This sensitivity leads institutional funds to trim equity weightings in favor of defensive cash or debt instruments.
Broader sector dynamics and institutional portfolio positioning have also compounded the intraday decline. Systematic trading algorithms and exchange-traded funds tracking natural resource and gold-mining benchmarks often execute automated liquidations during broad metal pullbacks, amplifying downside momentum. Given Newmont’s position as a heavyweight component in global mining indices, automated basket selling exacerbates price slippage during periods of risk repositioning.
Looking ahead, Newmont’s capacity to stabilize will depend heavily on the stabilization of bullion prices, currency stabilization, and management’s ability to demonstrate disciplined cost containment and steady production output across its tier-one asset portfolio. Until volatility in underlying commodity markets subsides and real yields settle, senior gold producers are likely to trade with heightened sensitivity to broader macroeconomic trends.
Technical Analysis of Newmont Corporation (NEM)
Technically, Newmont Corporation (NEM) shows a MACD (12,26,9) value of -1.664, indicating a sell signal. The RSI at 37.627 suggests neutral condition and the Williams %R at 90.453 suggests oversold condition. Please monitor closely.
Fundamental Analysis of Newmont Corporation (NEM)
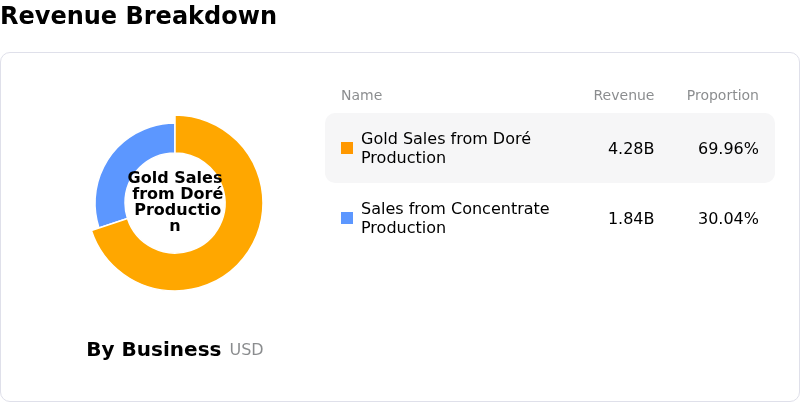
Newmont Corporation (NEM) is in the Mineral Resources industry. Its latest annual revenue is $22.67B, ranking 10 in the industry. The net profit is $7.08B, ranking 3 in the industry. Company Profile
Over the past month, multiple analysts have rated the company as Buy, with an average price target of $139.25, a high of $205.00, and a low of $79.00.
More details about Newmont Corporation (NEM)
Company Specific Risks:
- Sharp Unit Cost Inflation and Q4 AISC Surge: Institutional analysts are actively scrutinizing Newmont's near-term profitability following management's warning that All-In Sustaining Costs (AISC) are projected to surge toward $1,900 per ounce in the fourth quarter (up from $1,450 per ounce in Q3), exacerbated by persistent labor inflation running above internal 3% forecasts and an anticipated 30% drop in silver co-product credits at the Peñasquito mine.
- Substantial Capex Escalation on Long-Dated Mega Projects: Significant capital overhang is threatening free cash flow guidance due to the formal cost estimate of $4.2 billion to $4.8 billion for the Red Chris Block Cave project, which increases 2027 development capital by roughly $500 million and delays commercial production until 2033 while relying on unfinalized Canadian government subsidies.
- Operating and Climate Vulnerabilities at Offshore Assets: The company faces imminent operational interruptions across key foreign production assets, specifically impending water supply shortages driven by strengthening El Niño weather conditions at the Lihir mine in Papua New Guinea, combined with margin erosion from Ghana's mining royalty increases and residual production recovery lag from seismic disruption at Cadia.
- Heightened Valuation Multiple Compression During Commodity Pullback: Following an abrupt 3% drop in spot gold prices, Newmont shares suffered an intraday selloff exceeding 7% as algorithmic and institutional liquidations breached key moving-average supports, triggered by concerns that the stock was trading at a roughly 20% premium to intrinsic value amid sequential gross margin contraction.
This article may include AI-generated content that is human-reviewed, which is for reference and general information purposes only and does not constitute investment advice.
Recommended Articles








Comments (0)
Click the $ button, enter the symbol, and select to link a stock, ETF, or other ticker.