


Texas Instruments Inc Stock (TXN) Moved Up by 3.39% on Nov 11: A Full Analysis


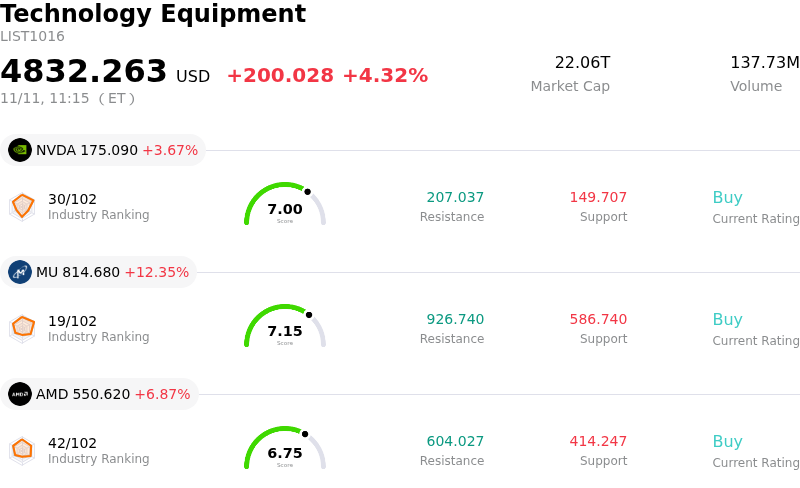
Texas Instruments Inc (TXN) moved up by 3.39%. The Technology Equipment sector is up by 4.32%. The company underperformed the industry. Top 3 stocks by turnover in the sector: NVIDIA Corp (NVDA) up 3.83%; Micron Technology Inc (MU) up 12.57%; Advanced Micro Devices Inc (AMD) up 6.85%.
What is driving Texas Instruments Inc (TXN)’s stock price up today?
Texas Instruments recorded a solid upward move amid elevated intraday activity, driven by broad-based institutional demand and reinforcing confidence in a multi-quarter cyclical recovery across the analog and embedded processing markets. A key catalyst behind the advance is the synchronised stabilization across core industrial and automotive verticals, paired with rapidly expanding exposure to artificial intelligence infrastructure. Modern AI data centers and high-density computing clusters require substantial power-management, signal-chain, and precision-timing components, enabling the company to tap into high-growth server hardware spend while its traditional industrial footprint resumes expansion.
Underpinning the rally is the company’s distinct structural cost advantage, stemming from multi-year capital investments in internal 300-millimeter wafer manufacturing. As factory utilization rates climb alongside improving order visibility, Texas Instruments is demonstrating substantial operating leverage, which cushions unit costs and provides a direct tailwind to gross margin expansion. Concurrently, firmer pricing across broad catalog lines suggests that distributor and customer inventories have largely normalized, allowing the firm to capture enhanced cash flows without conceding market share to peers facing lumpier recovery trajectories.
Institutional sentiment also benefited from favorable sector rotation and steady sell-side support. Investors increasingly favored high-quality, cash-generative semiconductor franchises that offer balanced growth and tangible capital returns over richly priced, single-theme hardware providers. Upward revisions to forward earnings estimates and steady dividend performance have solidified TXN as a preferred defensive-growth asset within technology allocations.
Looking ahead, while structural tailwinds and cyclical acceleration remain intact, institutional investors should balance their bullish stance against key market risks. The company trades at an elevated valuation multiple that leaves limited tolerance for macroeconomic softness or delays in industrial capex spending. Additionally, broader supply chain adjustments and fluctuating interest rate expectations could prompt intermittent volatility. Nonetheless, the prevailing catalyst path remains skewed to the upside as cyclical analog demand and data-center adoption converge.
Technical Analysis of Texas Instruments Inc (TXN)
Technically, Texas Instruments Inc (TXN) shows a MACD (12,26,9) value of -0.297, indicating a neutral signal. The RSI at 59.924 suggests neutral condition and the Williams %R at 13.900 suggests overbought condition. Please monitor closely.
Fundamental Analysis of Texas Instruments Inc (TXN)
Texas Instruments Inc (TXN) is in the Technology Equipment industry. Its latest annual revenue is $17.68B, ranking 14 in the industry. The net profit is $4.97B, ranking 10 in the industry. Company Profile
Over the past month, multiple analysts have rated the company as Buy, with an average price target of $325.89, a high of $400.00, and a low of $188.00.
More details about Texas Instruments Inc (TXN)
Company Specific Risks:
- Stretched Valuation and Multiple Compression Vulnerability: Trading at an elevated valuation multiple of roughly 36x to 38x trailing earnings—significantly above its five-year median of 28x—shares face acute vulnerability to profit-taking and multiple compression whenever broader semiconductor sentiment softens.
- Persistent Insider Divestment Pressures: Recent SEC Form 4 filings highlighted substantial insider selling by company directors, contributing to over $120 million in net insider distributions over recent trailing periods without offsetting open-market purchases, dampening institutional confidence.
- Substantial Capital Expenditure and Underutilization Risks: Texas Instruments' ongoing multi-billion-dollar buildout of 300mm fabrication capacity carries heavy fixed-cost overhead and rising depreciation, creating immediate operating margin exposure if analog fab utilization drops during cyclical fluctuations.
- Cyclical Reversal Risks Across Core Industrial and Automotive Markets: Despite recent demand stabilization, TXN remains highly exposed to rate-sensitive industrial and automotive segments, where any premature end to channel replenishment or order pushouts could abruptly jeopardize aggressive double-digit growth forecasts.
This article may include AI-generated content that is human-reviewed, which is for reference and general information purposes only and does not constitute investment advice.
Recommended Articles







Comments (0)
Click the $ button, enter the symbol, and select to link a stock, ETF, or other ticker.