


Solana (SOLUSD) Is up 1.06% on Nov 3: Here Is Why


Solana (SOLUSD) is up 1.06% at Nov 3 19:35(ET), now at $91.54, with a 7-day down of 8.50%.
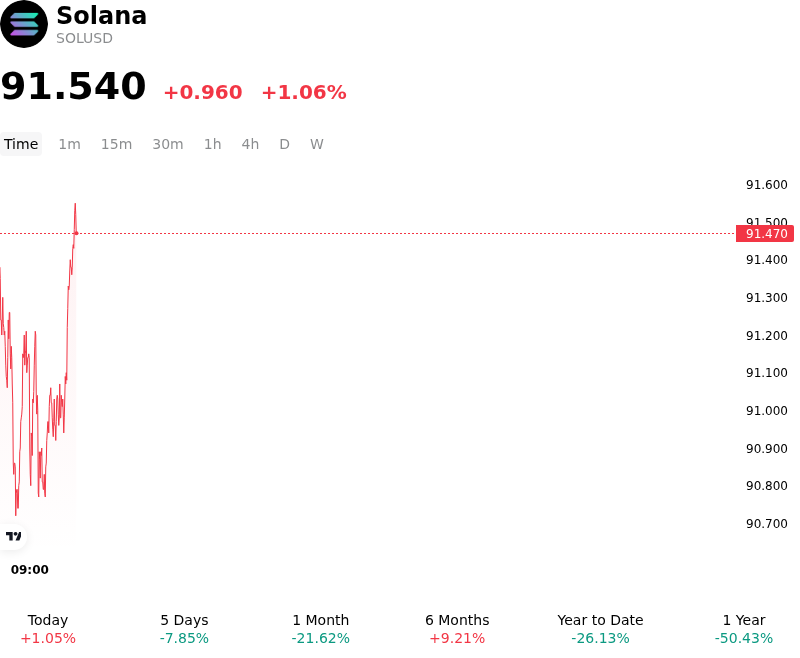
What is driving Solana (SOLUSD)’s stock price up today?
Capital inflows into Solana reflected a tactical recovery driven by oversold technical conditions, short covering in derivatives markets, and localized relief across broader digital asset risk sentiment. Following several sessions of downward momentum that pushed prices toward key support levels in the lower nineties, leveraged short positions faced margin compression, triggering buy-backs and an intraday liquidity rebound. The stabilization occurred as macro investors recalibrated exposure ahead of key U.S. macroeconomic milestones, including upcoming midterm elections and policy signals from the Federal Reserve, which temporarily restored risk appetite across top-tier layer-one protocol assets.
Fundamental support for the move was further underpinned by expanding institutional real-world asset tokenization and network infrastructure developments. The continued growth of tokenized equity offerings and high stablecoin settlement throughput on the blockchain highlighted sustained enterprise engagement. Additionally, investor sentiment was bolstered by the mainnet rollout of the Alpenglow protocol upgrade, designed to significantly enhance transaction finality speeds and runtime execution efficiency. The upgrade reinforced long-term scalability expectations, accompanying a milestone of sustained network reliability and record operational uptime.
Despite the positive intraday advance, institutional market participants continue to monitor structural headwinds and liquidity risks. Recent net outflows from spot Solana exchange-traded funds and large on-chain transfers of tokens to major custodial exchanges have maintained localized overhead supply pressure. Furthermore, overall network fee generation and decentralized exchange revenue trends remain under active evaluation. Investors are balancing immediate technical relief against broader macro liquidity constraints, keeping a close focus on Federal Reserve interest rate expectations, U.S. Treasury yields, and potential shifts in digital asset regulatory frameworks.
Technical Analysis of Solana (SOLUSD)
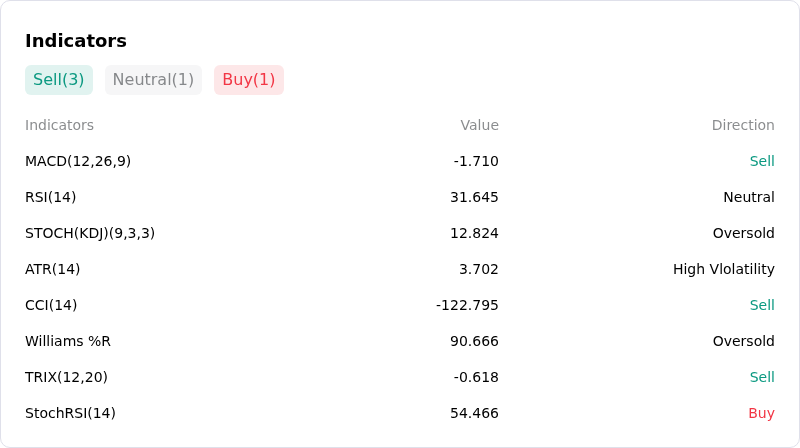
Technically, Solana (SOLUSD) shows a MACD (12,26,9) value of -1.710, indicating a sell signal. The RSI at 31.645 suggests neutral condition and the Williams %R at 90.666 suggests oversold condition. Please monitor closely.
More details about Solana (SOLUSD)
Recent Events and Risks:
- Record Institutional Spot ETF Outflows: U.S. spot Solana ETFs registered a record $71.47 million in weekly net outflows, marking four consecutive weeks of net redemptions and signaling deteriorating institutional demand.
- Concentrated Whale Exchange Deposits: On-chain tracking revealed a major whale transfer depositing approximately 1.49 million SOL (valued near $148.7 million) into centralized exchanges including Binance, Coinbase, and Kraken, creating substantial potential overhead supply pressure.
- Exploit Offloading and Validator Security Advisories: Market sentiment remains constrained following hacker wallet movements converting tens of millions of stolen SOL into Bitcoin swaps, alongside core developer alerts instructing network validators to implement protective measures against a Linux kernel vulnerability.
- Technical Breakdown and Derivatives Liquidation Risk: SOL/USD broke key technical support below the $100 psychological level and slipped under major exponential moving averages, increasing vulnerability to leveraged long liquidations if price action tests lower support near $88.42.
This article may include AI-generated content that is human-reviewed, which is for reference and general information purposes only and does not constitute investment advice.
Recommended Articles









Comments (0)
Click the $ button, enter the symbol, and select to link a stock, ETF, or other ticker.