


Solana (SOLUSD) Is up 1.02% on Nov 2: Key Drivers to Watch


Solana (SOLUSD) is up 1.02% at Nov 2 20:25(ET), now at $94.29, with a 7-day down of 5.07%.
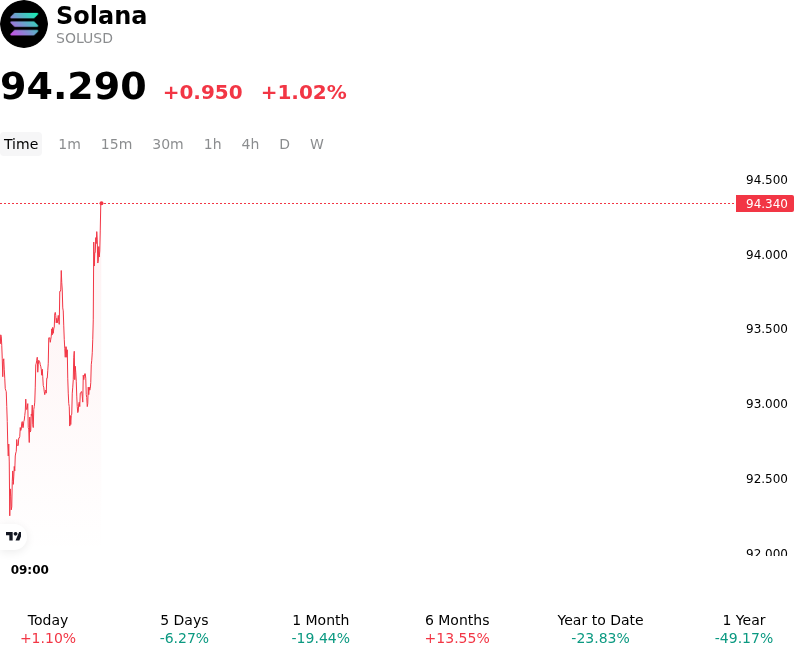
What is driving Solana (SOLUSD)’s stock price up today?
Solana demonstrated firming price action as capital moved into the asset following a successful defense of key structural support levels near the lower boundary of its recent trading range. After a period of leverage liquidations and compressed funding rates across crypto derivatives venues, short seller momentum faded near long-term moving averages, encouraging tactical short covering and spot-market accumulation. The stabilization in broader digital asset risk sentiment provided a conducive backdrop, allowing systematic buyers to step in and absorb prior selling pressure.
Underlying the upward drift is sustained momentum across Solana's enterprise and institutional ecosystem. Fundamental drivers, including the expansion of regulated regional stablecoin infrastructure in key global hubs and high network throughput in decentralized trading activity, bolstered long-term adoption expectations. While spot exchange-traded funds experienced selective rotational outflows in prior sessions, the underlying growth in tokenized real-world assets and network fee generation continues to attract institutional allocators seeking exposure to scalable high-throughput blockchains.
Market sentiment was additionally supported by the resolution of localized liquidity bottlenecks across centralized trading venues, which restored cross-exchange arbitrage efficiency and enhanced order book depth. As exchange operations normalized and deposit-withdrawal pathways cleared, localized selling pressure receded. Institutional market participants remain focused on macroeconomic catalysts, including Federal Reserve monetary policy expectations and US Treasury yield volatility, alongside spot ETF net flow trends to gauge whether the recent price recovery signals a structural trend continuation or temporary range-bound consolidation.
Technical Analysis of Solana (SOLUSD)
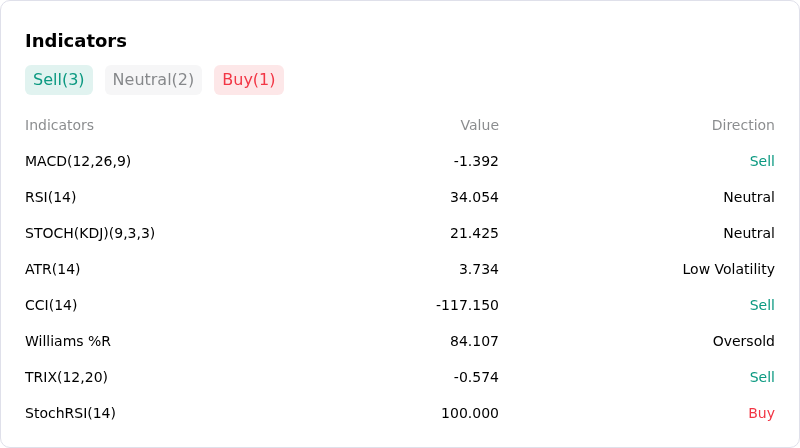
Technically, Solana (SOLUSD) shows a MACD (12,26,9) value of -1.406, indicating a sell signal. The RSI at 33.775 suggests neutral condition and the Williams %R at 84.762 suggests oversold condition. Please monitor closely.
More details about Solana (SOLUSD)
Recent Events and Risks:
- Macro Liquidity Tightening and Cross-Venue Contagion: Rising US Treasury yields and a firm US Dollar have tightened global liquidity, prompting institutional allocators to trim exposure to high-beta smart contract platforms. This macro risk-off sentiment was compounded by cross-venue market panics and exchange security exploits, driving SOL below the psychological $100 support level.
- Sustained Spot ETF Outflows: Institutional demand for US spot Solana ETFs has slowed sharply, recording deep daily net outflows and redemptions. The absence of institutional spot buying leaves the token exposed to unabsorbed spot market supply testing critical technical supports.
- Derivatives Long Liquidations and Leverage Unwinds: Perpetual futures markets have experienced cascades of long liquidations as leveraged positions near resistance bands were forced to unwind. This unwinding has compressed funding rates toward neutral across major derivatives venues, signaling ongoing intraday volatility and reduced speculative margin cushions.
- Bearish Technical Breakdown and Chart Formations: Technical indicators show negative momentum, with daily MACD sell signals and price action trading below both 20-day and 50-day moving averages. Chart analysts highlight a potential head-and-shoulders pattern on daily timeframes, which risks triggering further liquidations toward $80–$90 if support around $95–$98 fails.
This article may include AI-generated content that is human-reviewed, which is for reference and general information purposes only and does not constitute investment advice.
Recommended Articles







Comments (0)
Click the $ button, enter the symbol, and select to link a stock, ETF, or other ticker.