


Salesforce Inc Stock (CRM) Moved Down by 4.46% on Oct 29: What Signal Does It Send?



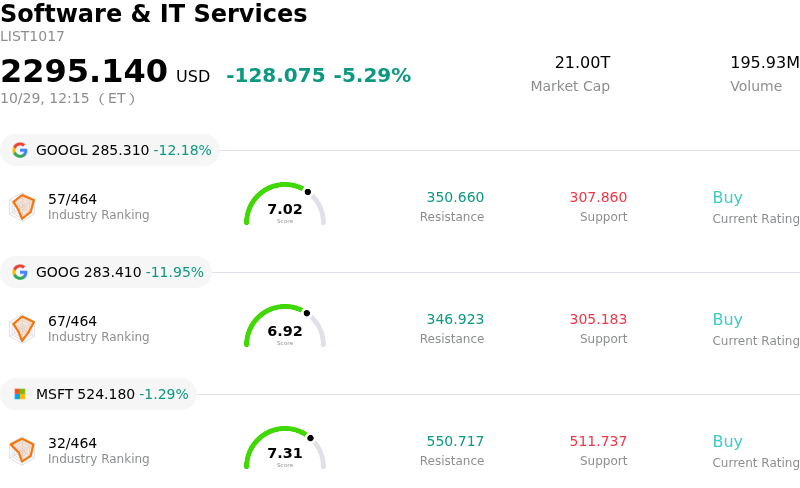
Salesforce Inc (CRM) moved down by 4.46%. The Software & IT Services sector is down by 5.29%. The company outperformed the industry. Top 3 stocks by turnover in the sector: Alphabet Inc Class A (GOOGL) down 12.18%; Alphabet Inc Class C (GOOG) down 11.95%; Microsoft Corp (MSFT) down 1.28%.
What is driving Salesforce Inc (CRM)’s stock price down today?
Salesforce experienced downward pressure and heightened intraday volatility primarily driven by broad-based selling across the enterprise software sector. Weakness in peer cloud software vendors, triggered by cautious forward booking metrics and slowing contracted revenue projections from industry peers like ServiceNow, sparked sector-wide concerns regarding enterprise IT expenditure. Investors grew cautious about potential deal delays, seat contraction, and extended sales cycles across corporate clients, weighing heavily on major software constituents and sector-tracking ETFs.
Investor sentiment has also been tempered by ongoing scrutiny over Salesforce’s acquisition strategy, including its multi-billion-dollar deal to acquire customer engagement platform Braze alongside recent buyouts such as Contentful and Fin. While these transactions aim to expand the Agentforce ecosystem and reinforce the company's marketing and customer data capabilities, market participants remain focused on whether underlying revenue expansion is driven by core organic demand or inorganic additions. Elevated balance sheet leverage from consecutive acquisitions has further heightened investor focus on cash flow growth relative to top-line expansion.
While Salesforce continues to roll out AI innovations under its Agentforce banner and implement consumption-based AI billing, markets are seeking definitive evidence that these initiatives will drive clear organic reacceleration in upcoming quarterly results. Broader sector risk aversion and portfolio rebalancing by institutional holders amplified intraday volatility. Despite constructive long-term Wall Street ratings and ongoing share buyback programs, short-term valuation multiple compression across the software landscape continues to limit immediate upward momentum.
Technical Analysis of Salesforce Inc (CRM)
Technically, Salesforce Inc (CRM) shows a MACD (12,26,9) value of -1.318, indicating a neutral signal. The RSI at 43.964 suggests neutral condition and the Williams %R at 77.319 suggests sell condition. Please monitor closely.
Media Coverage of Salesforce Inc (CRM)
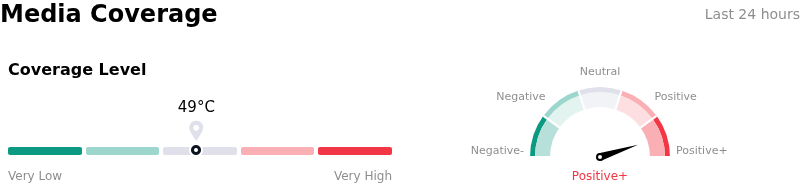
In terms of media coverage, Salesforce Inc (CRM) shows a coverage score of 49, indicating a moderate level of media attention. The overall market sentiment index is currently in extremely bullish zone.
Fundamental Analysis of Salesforce Inc (CRM)
Salesforce Inc (CRM) is in the Software & IT Services industry. Its latest annual revenue is $41.52B, ranking 14 in the industry. The net profit is $7.46B, ranking 15 in the industry. Company Profile
Over the past month, multiple analysts have rated the company as Buy, with an average price target of $290.78, a high of $475.00, and a low of $195.00.
More details about Salesforce Inc (CRM)
Company Specific Risks:
- Enterprise Software Spending Contagion: A sharp deceleration in contracted revenue backlog reported by peer ServiceNow triggered a sector-wide software selloff, intensifying investor fears of slowing enterprise subscription demand and extended sales cycles for Salesforce's platform.
- Capital Allocation and Integration Risks from $5.66 Billion Braze Acquisition: Following recent SEC filings detailing the $5.66 billion planned purchase of Braze, analysts highlighted concerns regarding margin pressure, execution risks, and capital allocation efficiency during a period of macroeconomic software tightening.
- Sluggish Billings Growth and AI Monetization Skepticism: Fresh analyst reports flagged an unimpressive ~11.2% average billings growth over the past year and muted near-term revenue projections of ~10.4%, raising doubts over whether Agentforce AI adoption can reaccelerate top-line growth fast enough.
- Technical Support Breakdown and Increased Selling Pressure: Intraday downside momentum forced the stock below key technical levels—specifically its 20-day ($237.59) and 50-day ($238.40) moving averages—triggering algorithmic selling and pushing shares toward multi-week lows.
This article may include AI-generated content that is human-reviewed, which is for reference and general information purposes only and does not constitute investment advice.
Recommended Articles







Comments (0)
Click the $ button, enter the symbol, and select to link a stock, ETF, or other ticker.