


Silver (XAGUSD) Is down 2.14% on Oct 29: What Is Driving the Move?



Silver (XAGUSD) is down 2.14% at Oct 29 02:00(ET), now at $52.792, with a 7-day down of 3.27%.
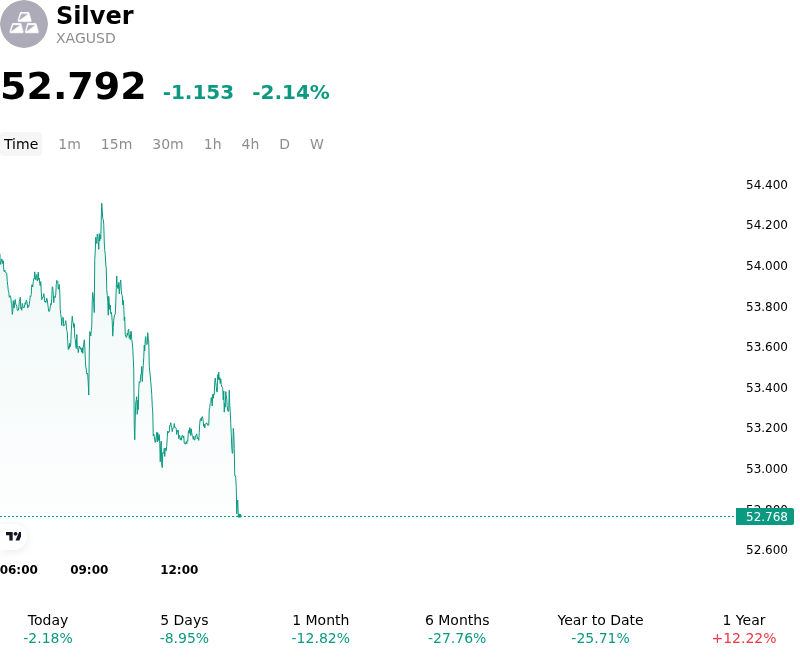
What is driving Silver (XAGUSD)’s stock price down today?
Spot silver experienced notable downward pressure as market participants reacted to tightening macroeconomic conditions, firming Treasury yields, and a stronger US dollar. The primary catalyst behind the movement stems from recalibrated central bank policy expectations. Following the Federal Reserve's policy announcement to maintain benchmark rates, hawkish underlying tone and policy dissents reinforced market expectations that interest rates will remain elevated for longer. Persistent inflation concerns, fueled by high energy prices, kept long-dated U.S. bond yields elevated, directly increasing the opportunity cost of holding non-yielding precious metals.
The broader macroeconomic environment was further complicated by the US dollar's firm footing, which created additional headwinds for dollar-denominated commodities. While geopolitical risks and energy market volatility typically generate safe-haven demand, the immediate focus of institutional investors remained firmly on real yields and monetary policy expectations. Consequently, capital flows favored interest-bearing assets over precious metals, dampening speculative length and institutional allocation.
Beyond monetary factors, silver's dual character as both a financial asset and an industrial metal intensified its downside exposure. Industrial demand expectations continue to face headwind pressures due to subdued global manufacturing metrics and reported reductions in silver usage across key technology sectors, including photovoltaics and electronics. This softening in the physical demand outlook stripped out part of silver's industrial premium, leaving prices more exposed to macro tightening than less industrial-focused peers like gold.
From a technical and market structure perspective, the retreat below key short-term support levels triggered systematic selling and stop-loss execution across futures and derivative markets. Continuous fund outflows from physically backed exchange-traded products further reinforced the intraday decline. While structural supply deficits outlined by industry associations provide medium-term underlying support, short-term market dynamics remain governed by real yield momentum, currency strength, and macro positioning.
Technical Analysis of Silver (XAGUSD)
Technically, Silver (XAGUSD) shows a MACD (12,26,9) value of -0.573, indicating a sell signal. The RSI at 30.843 suggests neutral condition and the Williams %R at 95.381 suggests oversold condition. Please monitor closely.
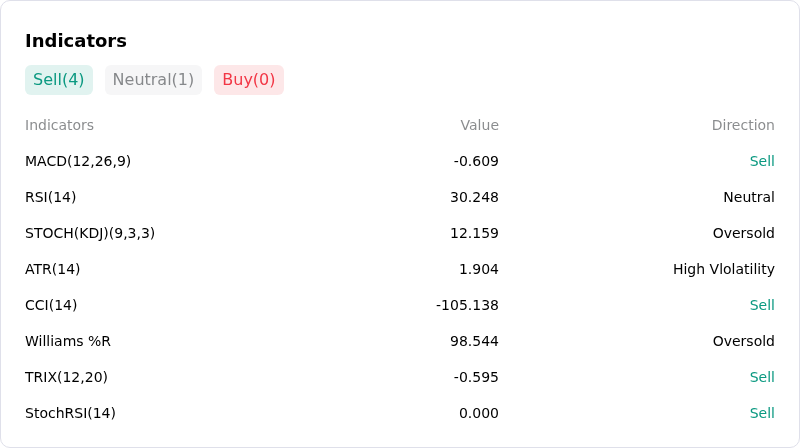
More details about Silver (XAGUSD)
Recent Events and Risks:
- Hawkish Monetary Policy and Elevated Real Yields: Persistent inflation concerns driven by elevated energy costs and sticky core inflation metrics have strengthened market expectations for a prolonged "higher-for-longer" Federal Reserve interest rate stance. With U.S. 10-year Treasury yields hovering near 5% and a firming U.S. dollar index, the opportunity cost of holding non-yielding spot silver remains high, triggering sustained institutional portfolio outflows.
- Industrial Offtake Deterioration and Photovoltaic Thrifting: Sluggish manufacturing activity in major consumer markets like China and rising factory input costs continue to weigh on physical silver demand. Furthermore, elevated metal costs have accelerated "silver thrifting" initiatives among photovoltaic solar panel manufacturers, who are actively reducing silver intensity and substituting the metal with copper, threatening long-term industrial consumption forecasts.
- Cross-Asset Margin Calls and Forced Liquidation: Widespread sell-offs across equity markets and leveraged technology shares have generated acute liquidity stress for institutional funds. To cover broker margin calls and meet immediate cash collateral demands, hedge funds and derivative traders are liquidating spot silver and paper futures positions, compounding intraday downside pressure.
- Technical Support Breakdown and Automated Stop-Loss Selling: A decisive breach of key short-term support levels between $53.50 and $55.00 per ounce has accelerated speculative long liquidation. Trading persistently below major short-term moving averages has triggered automated stop-loss orders in derivative markets, reinforcing negative momentum and keeping the near-term technical bias skewed to the downside.
This article may include AI-generated content that is human-reviewed, which is for reference and general information purposes only and does not constitute investment advice.
Recommended Articles










Comments (0)
Click the $ button, enter the symbol, and select to link a stock, ETF, or other ticker.