


Ethereum (ETHUSD) Is down 1.14% on Oct 29: Here Is Why



Ethereum (ETHUSD) is down 1.14% at Oct 29 21:40(ET), now at $2331.45, with a 7-day down of 2.06%.
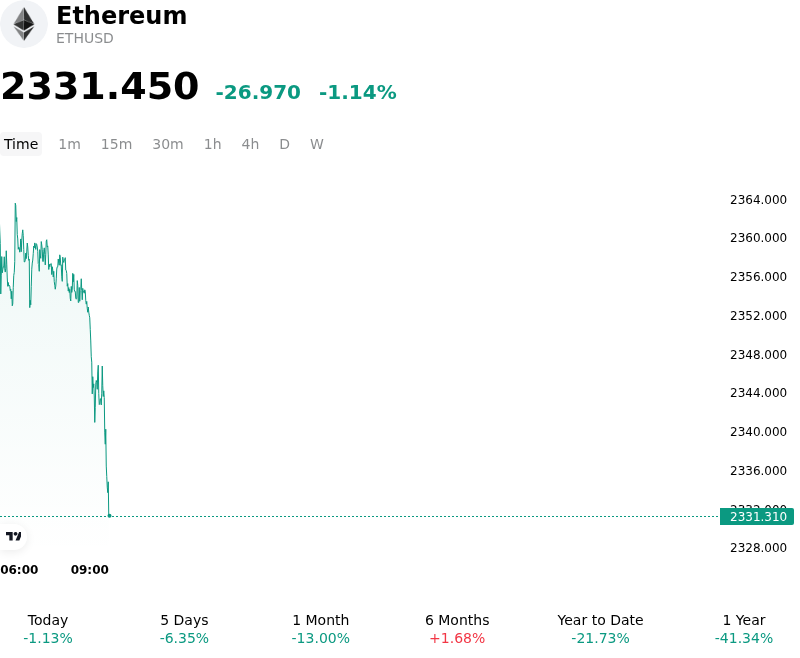
What is driving Ethereum (ETHUSD)’s stock price down today?
The downside movement in Ethereum reflects persistent headwinds from tight global liquidity conditions and an unfavorable interest rate environment following the Federal Reserve's recent monetary policy stance. With benchmark interest rates held in an elevated target range and hawkish dissents signaling potential further tightening, elevated U.S. Treasury yields continue to curb institutional risk appetite across digital assets. For Ethereum specifically, the current yield backdrop creates structural pressure, as its annualized staking yield trails prevailing dollar risk-free rates. This yield gap reduces the relative incentive for institutional investors to hold or stake Ether when competing money-market instruments offer higher guaranteed returns without price volatility.
Institutional flow dynamics have further exacerbated market pressure, driven by extended net outflows from U.S. spot Ethereum exchange-traded funds. Capital withdrawals across major spot ETH products have accumulated significantly throughout October, signaling a shift in institutional positioning toward capital preservation and selective rotation into major crypto benchmarks. The persistent redemptions from spot funds directly impact spot market liquidity, restricting organic buying power and leaving price action vulnerable to localized selling volume.
Ecosystem-specific catalysts have also failed to provide near-term momentum following the announced delay of the protocol's upcoming Glamsterdam network upgrade. Technical complications during testnet evaluations postponed key execution-layer and consensus optimizations, removing a major fundamental catalyst that investors had anticipated would enhance network throughput and transaction fee mechanisms. In the derivatives market, the absence of strong upside momentum triggered long liquidations as price action tested critical technical support zones, while recent on-chain whale distributions further weighed on short-term market sentiment.
Technical Analysis of Ethereum (ETHUSD)
Technically, Ethereum (ETHUSD) shows a MACD (12,26,9) value of -10.180, indicating a sell signal. The RSI at 39.453 suggests neutral condition and the Williams %R at 78.241 suggests sell condition. Please monitor closely.
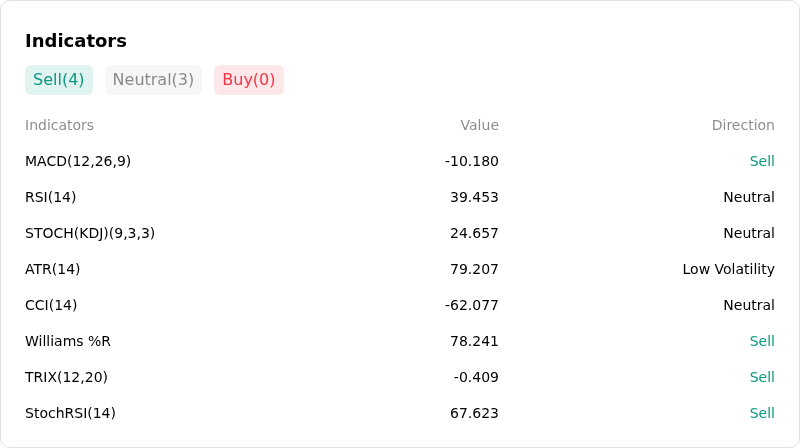
More details about Ethereum (ETHUSD)
Recent Events and Risks:
- Institutional Spot ETF Outflows: U.S. spot Ethereum ETFs recorded over $1.26 billion in net monthly redemptions, with ongoing daily outflows exceeding $60 million stripping away key institutional spot demand and compounding selling pressure across exchanges.
- Concentrated Long Liquidation Risk: Elevated leverage across derivative venues has exposed significant structural downside fragility, with market data indicating up to $676 million in long positions subject to forced liquidations if ETH breaks below key support at $2,286, alongside major whale positions facing liquidation thresholds near $2,180.
- Protocol Upgrade Delay: Core developers postponed the testnet deployment of the Glamsterdam upgrade following security concerns surrounding gas-pricing proposals EIP-8037 and EIP-8038, depriving Ethereum of a key near-term fundamental catalyst.
- Technical Overhead Resistance and Weak On-Chain Activity: Rejection below important technical clusters—such as the 50-day and 100-day exponential moving averages between $2,362 and $2,450—coupled with declining daily active network addresses, keeps ETH vulnerable to a breakdown toward lower support floors near $2,200.
This article may include AI-generated content that is human-reviewed, which is for reference and general information purposes only and does not constitute investment advice.
Recommended Articles









Comments (0)
Click the $ button, enter the symbol, and select to link a stock, ETF, or other ticker.