


Ethereum (ETHUSD) Is up 1.33% on Oct 28: Here Is Why



Ethereum (ETHUSD) is up 1.33% at Oct 28 04:30(ET), now at $2373.35, with a 7-day down of 4.69%.
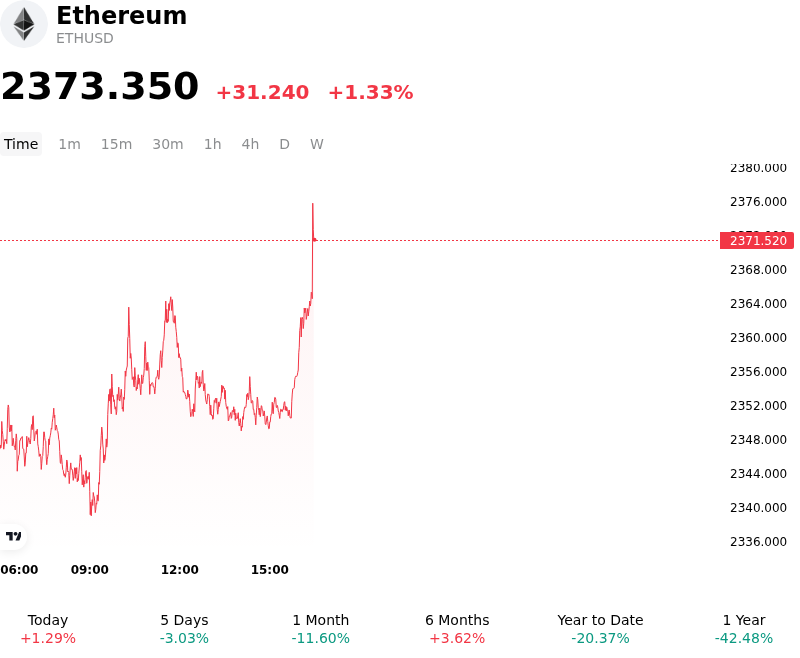
What is driving Ethereum (ETHUSD)’s stock price up today?
Capital flowed into Ethereum as the asset stabilized above critical structural support near its long-term moving average and average cost basis. Following sustained downside pressure earlier in the month, defensive spot buying around these multi-month technical floors altered short-term order book dynamics. This technical bounce triggered forced short covering across derivatives venues, where concentrated short position liquidations accelerated upward intraday momentum as sellers failed to push prices below key support zones.
Macroeconomic liquidity conditions and market sentiment provided additional tailwinds. Broader risk assets stabilized as market participants positioned ahead of the Federal Reserve interest rate decision. Expectations of monetary policy stability reduced systemic volatility, while a modest rebound in equity markets and easing Treasury yield pressures encouraged risk appetite across major digital assets. Furthermore, despite broader monthly headwinds for regulated digital asset products, localized capital inflows into select spot Ethereum exchange-traded funds helped absorb ongoing exchange liquidity supply.
On-chain protocol developments also supported sentiment, highlighted by scheduled updates to decentralized naming infrastructure that reinforced long-term ecosystem development narratives. While investors remain attentive to potential risks involving core network upgrade timelines and persistent fund outflow trends, the intraday advance primarily reflects a liquidity-driven relief rally supported by derivatives positioning and technical support defense. Market participants continue to monitor ETF capital flows and central bank policy guidance to assess whether this upward trajectory can transition into sustained recovery.
Technical Analysis of Ethereum (ETHUSD)
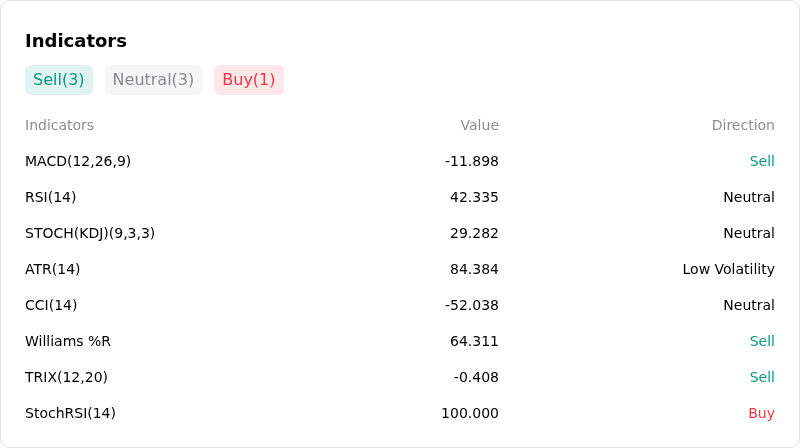
Technically, Ethereum (ETHUSD) shows a MACD (12,26,9) value of -11.898, indicating a sell signal. The RSI at 42.335 suggests neutral condition and the Williams %R at 64.311 suggests sell condition. Please monitor closely.
More details about Ethereum (ETHUSD)
Recent Events and Risks:
- Institutional Spot ETF Outflows: Persistent net redemptions from U.S. spot Ethereum ETFs have driven significant capital flight over recent sessions, pushing monthly net outflows past $1 billion and severely dampening institutional spot demand.
- Derivatives Leverage and Liquidation Risk: Derivatives market structure displays significant vulnerability, with cumulative long-liquidation pools of up to $676 million exposed on centralized exchanges if spot prices break below critical support near $2,286.
- Technical Channel Breakdown and ETH/BTC Weakness: Ethereum failed to reclaim overhead resistance near $2,440–$2,500 and broke below key support channels, while the ETH/BTC ratio weakened toward 0.029, underscoring persistent altcoin underperformance against Bitcoin.
- Macro Risk-Off and Geopolitical Pressures: Broad risk aversion driven by elevated energy prices, sticky inflation data, and uncertainty around central bank rate decisions continues to drag liquidity away from high-beta digital assets.
This article may include AI-generated content that is human-reviewed, which is for reference and general information purposes only and does not constitute investment advice.
Recommended Articles











Comments (0)
Click the $ button, enter the symbol, and select to link a stock, ETF, or other ticker.