


Alphabet Stock Price Forecast: Hits 3-Month Low After 5-Day Drop, Could Fall Another 15% If Earnings Disappoint



AI Podcast


Alphabet shares fell for five consecutive sessions to three-month lows ahead of its fiscal Q3 2026 earnings report on October 28 Eastern Time, driven by high Treasury yields, tech deleveraging, and FOMC rate decision anxieties. Markets anticipate strong revenue and EPS growth, but negative free cash flow, elevated capital expenditure guidance, and potential cloud deceleration pose significant downside risks. If earnings disappoint, the stock could decline 15% toward the $270–$275 support level. Conversely, stronger-than-expected cloud growth and moderating CapEx could propel the stock past key resistance toward $400.

TradingKey - Alphabet stock falls for five consecutive sessions ahead of earnings, risks extending losses by 15% if results disappoint.
On October 27 Eastern Time, Alphabet (GOOG) rose slightly by 0.2% in overnight trading, temporarily trading at $317.34. Over the past five trading sessions, Alphabet's stock price has continued to fall, touching a low near $317.00 – $320.20, hitting a new low in nearly three months.
Amid the combined impact of intense deleveraging across tech stocks, 10-year US Treasury yields remaining high at 5%, and rising risk aversion ahead of the Federal Reserve's FOMC interest rate decision meeting, Alphabet, one of the Magnificent Seven tech giants, (GOOG) was hit hard. Under these adverse circumstances, the market pins its hopes on the fiscal Q3 2026 financial report to be released after the US market close this Wednesday (October 28).
However, as free cash flow (FCF) turned negative in the previous quarter (Q2) and capital expenditure guidance was significantly revised upward, the stock plunged 7.1% the following day. If the Q3 earnings report fails again in controlling capex or advertising growth, the stock price could trigger a chain liquidation, further seeking a 15% downside to retest the stage bottom of $270–$275.
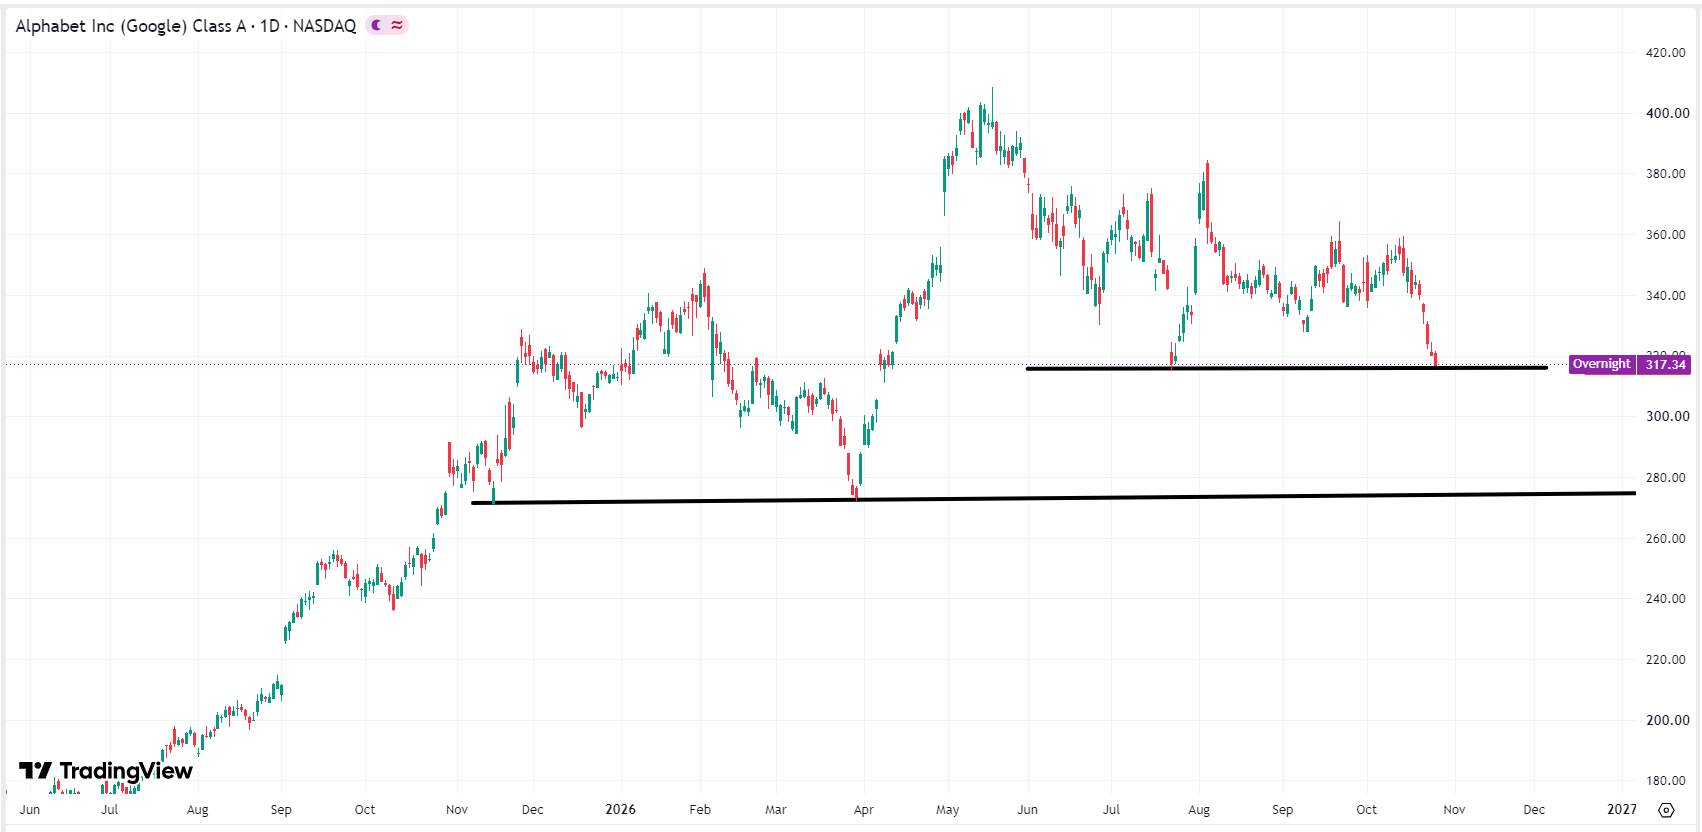 Google stock price chart, Source: TradingView
Currently, market expectations for Alphabet's core financial metrics are far higher than the same period last year (as shown below), making it easy to fall short of market expectations. If Q3 free cash flow remains negative, 2027 CapEx guidance signals continued expansion, and Google Cloud's growth rate drops below 70%, the likelihood of Alphabet testing $270 becomes very high.
Core Financial Metrics | Market Consensus Estimates | Prior Year Period (Q3 FY25) |
Revenue | $127.4 billion – $127.9 billion | $102.3 billion |
Earnings Per Share (EPS) | $3.02 | $2.87 |
Full-Year 2026 CapEx Guidance | $195.0B – $205.0 billion | N/A |
Of course, if the earnings report beats expectations—for instance, if Google Cloud growth approaches 90%, management hints at slowing CapEx growth in 2027, and reaffirms a path to improving free cash flow—the stock price will immediately break through the dual moving average resistance of $335.00 – $345.00 on heavy volume, opening up a valuation recovery rally toward the all-time high of $400.
This content was translated using AI and reviewed for clarity. It is for informational purposes only.
Recommended Articles











Comments (0)
Click the $ button, enter the symbol, and select to link a stock, ETF, or other ticker.