


Ethereum (ETHUSD) Suddenly Goes down 2.28% on Oct 25: What's Driving This



Ethereum (ETHUSD) is down 2.28% at Oct 25 20:35(ET), now at $2344.5, with a 7-day down of 0.18%.
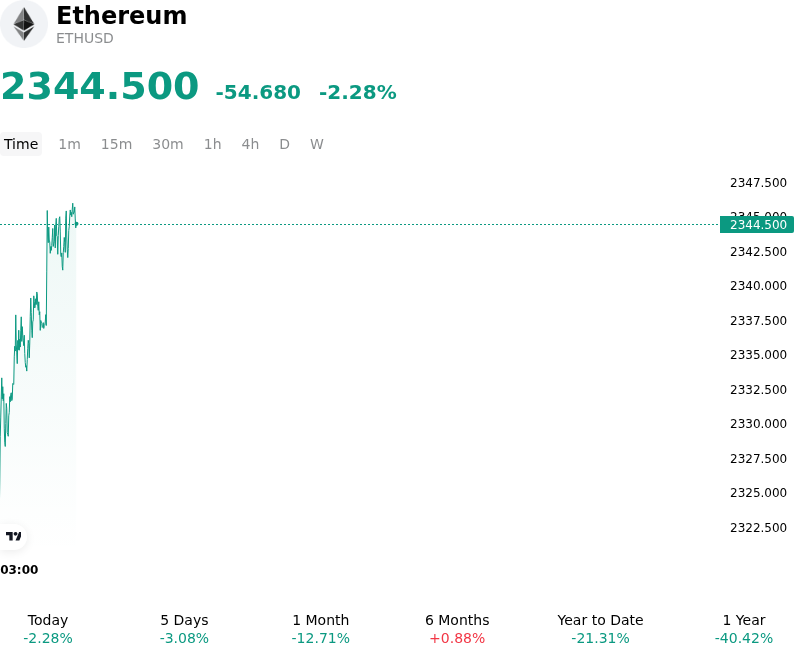
What is driving Ethereum (ETHUSD)’s stock price down today?
Sustained institutional redemptions from spot Ether exchange-traded funds weighed heavily on spot market buy-side liquidity, dampening investor confidence across the digital asset sector. Multi-week cumulative net withdrawals from institutional spot funds reflected persistent portfolio rebalancing, depriving Ethereum of a vital structural bid that had historically supported price consolidation. Compounding these fund outflows, elevated U.S. Treasury yields and broader macroeconomic uncertainty kept real yields attractive, encouraging portfolio managers to scale back exposure to high-beta smart contract platforms in favor of cash and sovereign debt instruments.
Derivatives market dynamics further accelerated downward price momentum during the session. A concentrated overhang of leveraged long positions near key technical support zones was breached, triggering a rapid series of forced liquidations across major trading venues. As long liquidations accounted for the overwhelming majority of forced market closures, perpetual futures funding rates rapidly unwound toward zero. This sharp drop in funding rates signaled that leverage was aggressively flushed from the system, leaving spot order books exposed to incremental market selling without immediate derivative absorption.
Ecosystem-specific friction also contributed to a more conservative posture among tactical traders. The temporary postponement of the Glamsterdam upgrade deployment on the Hoodi test network—delayed so developers could further review gas fee adjustments and contract execution safety—temporarily muted speculative enthusiasm surrounding the network's short-term scaling milestones. Moving forward, institutional investors continue to monitor spot ETF flow stabilization, Federal Reserve policy expectations, and leverage normalization in perpetual contracts as essential preconditions for renewed capital allocation.
Technical Analysis of Ethereum (ETHUSD)
Technically, Ethereum (ETHUSD) shows a MACD (12,26,9) value of -21.094, indicating a sell signal. The RSI at 37.977 suggests neutral condition and the Williams %R at 78.339 suggests sell condition. Please monitor closely.
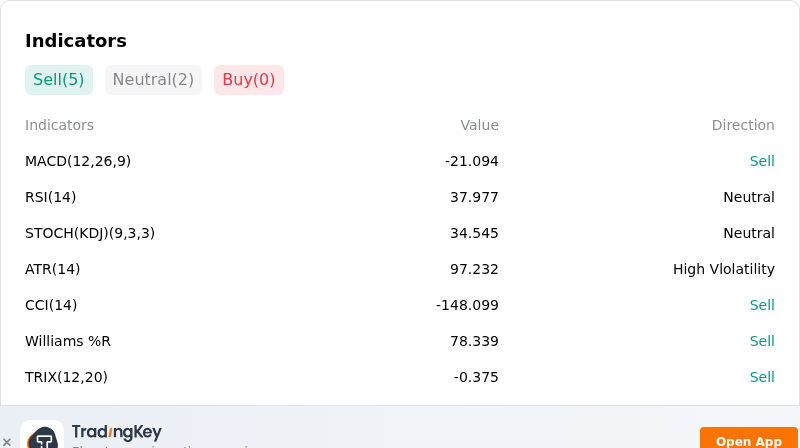
More details about Ethereum (ETHUSD)
Recent Events and Risks:
- Institutional Spot ETF Outflows: Persistent redemptions from U.S. spot Ethereum ETFs, totaling over $224 million in net weekly withdrawals across four consecutive weeks of net outflows, reflect cooling institutional demand and sustained U.S. spot market selling pressure.
- High-Profile Whale and Early Holder Distribution: On-chain data indicates accelerated selling from major market participants, including a genesis-era ICO investor transferring 1,000 ETH to Kraken and high-profile traders liquidating multi-million dollar ETH holdings, adding immediate overhead supply to spot exchanges.
- Derivatives Deleveraging and Liquidation Cascades: Ethereum net taker volume across perpetual futures has flipped negative, while ETH's breakdown beneath key 20-day and 50-day moving averages leaves over $670 million in leveraged long positions exposed to forced liquidation risks if key support near $2,313 breaks.
- Macro Risk-Off and Equity Sell-Off Spillover: A sharp pullback in technology equities and broader risk assets has amplified crypto market volatility, causing Ethereum to suffer deeper percentage losses than Bitcoin as capital flees high-beta digital assets ahead of upcoming monetary policy decisions.
This article may include AI-generated content that is human-reviewed, which is for reference and general information purposes only and does not constitute investment advice.
Recommended Articles







Comments (0)
Click the $ button, enter the symbol, and select to link a stock, ETF, or other ticker.