


Solana (SOLUSD) Is down 1.53% on Oct 24: Here Is Why



Solana (SOLUSD) is down 1.53% at Oct 24 21:05(ET), now at $101.34, with a 7-day down of 1.80%.
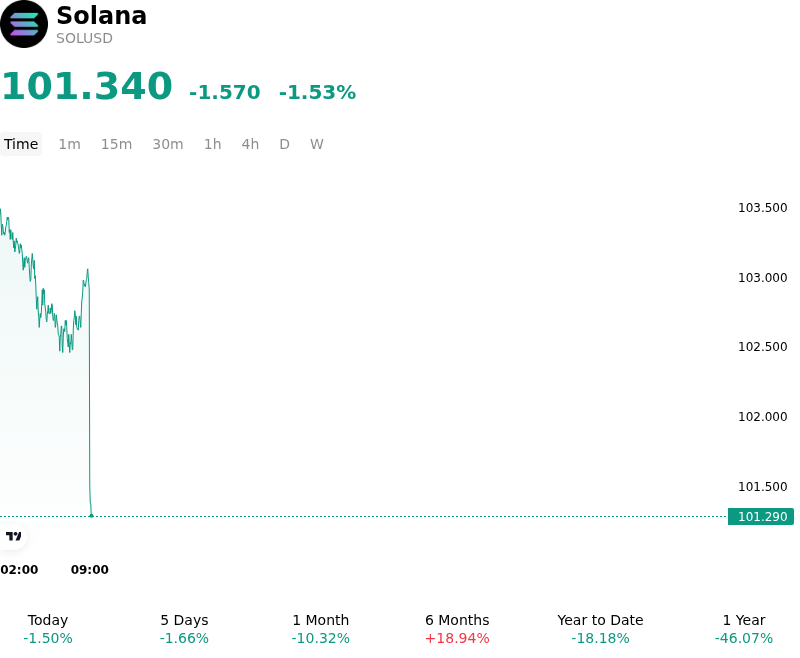
What is driving Solana (SOLUSD)’s stock price down today?
A broader risk-off posture across digital assets and high-growth equities exerted downward pressure on Solana, as elevated U.S. Treasury yields and cautious positioning ahead of the upcoming Federal Reserve monetary policy decision dampened market-wide risk appetite. This macroeconomic headwind coincided with a pullback in institutional capital flows, characterized by net redemptions across U.S. spot Solana exchange-traded funds following weeks of steady accumulation. The reduction in institutional spot buying momentum left order books vulnerable to sell-side liquidity, preventing bulls from sustaining recent recovery attempts.
The intraday decline also reflects an event-driven repricing in the aftermath of Solana's major technical milestone. Following the mainnet activation of the Alpenglow consensus upgrade, which successfully optimized block production and reduced transaction finality to roughly 150 milliseconds, market participants engaged in profit-taking. This textbook sell-the-news dynamic was exacerbated by technical rejection at key short-term exponential moving averages. As spot prices retreated below short-term support levels, automated risk management and stop-loss triggers across perpetual futures platforms led to minor long liquidations, accelerating downside momentum.
From a structural perspective, Solana's underlying network fundamentals remain robust, supported by strong quarterly processing volumes, expanding stablecoin issuance, and growing institutional integration of its settlement infrastructure for tokenized financial instruments. The current price adjustment appears to be a technical and liquidity-driven consolidation rather than a fundamental shift in adoption expectations. Institutional investors continue to monitor upcoming Federal Reserve rate expectations, broader equity market correlations, and the resumption of net spot ETF inflows to gauge the sustainability of the asset's medium-term trajectory.
Technical Analysis of Solana (SOLUSD)
Technically, Solana (SOLUSD) shows a MACD (12,26,9) value of -1.178, indicating a sell signal. The RSI at 42.341 suggests neutral condition and the Williams %R at 73.225 suggests sell condition. Please monitor closely.
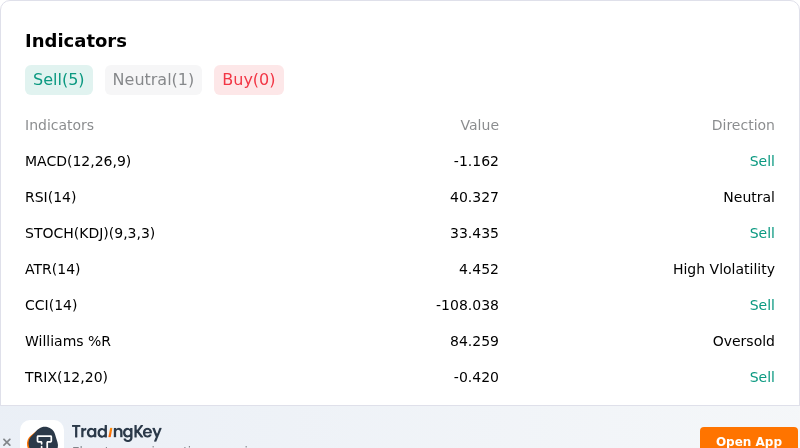
More details about Solana (SOLUSD)
Recent Events and Risks:
- Persistent Spot ETF Outflows: Spot Solana exchange-traded funds have recorded continuous net daily redemptions, removing structural institutional buy-side support and placing sustained overhead supply pressure on SOLUSD.
- Head-and-Shoulders Pattern Threatening Key Support: Technical analysis highlights a daily head-and-shoulders chart formation, where a sustained breakdown below the critical $100 psychological support level risks triggering cascading stop-loss liquidations toward lower support zones near $80.
- Exchange-Bound Whale Transfers: On-chain monitoring reveals massive exchange-bound whale activity, including over 470,000 SOL transferred directly to Coinbase, heightening immediate risk of large-scale spot market sell-offs.
- Post-Upgrade "Sell-the-News" and Derivatives Liquidations: The mainnet deployment of the Alpenglow upgrade failed to catalyze upward price momentum, resulting in a "sell-the-news" dynamic alongside futures open interest contraction and elevated long liquidation risk.
This article may include AI-generated content that is human-reviewed, which is for reference and general information purposes only and does not constitute investment advice.
Recommended Articles











Comments (0)
Click the $ button, enter the symbol, and select to link a stock, ETF, or other ticker.