


BHP Group Ltd Stock (BHP) Moved Down by 3.70% on Oct 22: Key Drivers Unveiled



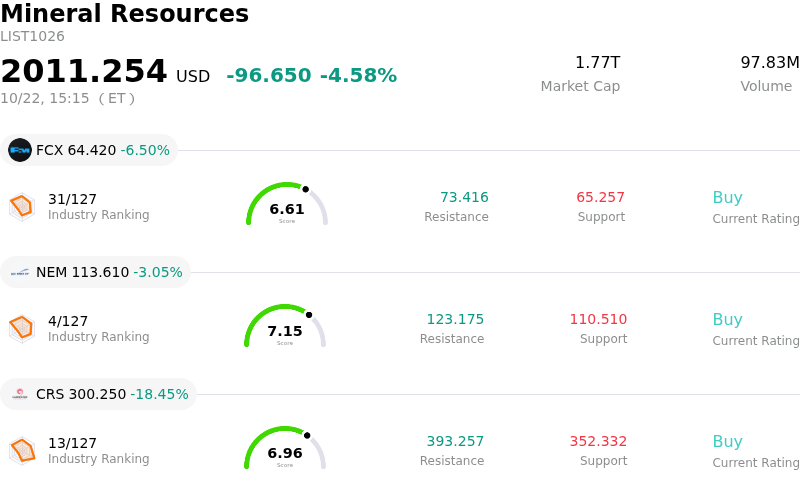
BHP Group Ltd (BHP) moved down by 3.70%. The Mineral Resources sector is down by 4.58%. The company outperformed the industry. Top 3 stocks by turnover in the sector: Freeport-McMoRan Inc (FCX) down 6.50%; Newmont Corporation (NEM) down 3.16%; Carpenter Technology Corp (CRS) down 18.45%.
What is driving BHP Group Ltd (BHP)’s stock price down today?
BHP experienced noticeable sell-side pressure as investors reacted to a combination of disappointing operational updates and weaker commodity market conditions. The mining giant's recent first-quarter operational review revealed a significant year-over-year decline in copper production that fell short of consensus estimates. Operating performance was impacted by lower ore grades, scheduled maintenance, and temporary disruptions linked to severe weather in Chile. Furthermore, temporary work suspensions following fatal safety incidents at key sites and mechanical failures at Australian assets restricted copper output, offsetting record operational performance in Western Australian iron ore.
In addition to asset-level disruptions, broader commodity market headwinds continue to curb investor enthusiasm. Benchmark iron ore prices have faced ongoing downward momentum, trading near multi-year lows amid lingering concerns over Chinese real estate weakness and softening steel demand. Although higher realized copper prices provided some offset earlier in the period, the pullback in industrial metal markets and lower average prices for bulk commodities have squeezed near-term margin expectations for major diversified miners.
Sell-side sentiment has adjusted accordingly, with several investment banks revising price targets downward and maintaining neutral outlooks. Analyst cautions focus on near-term volume risks, elevated freight and energy expenses, and persistent global trade uncertainties highlighted during the company's recent shareholder meeting. Together, these operational bottlenecks, falling bulk commodity prices, and broker revisions have weighed heavily on investor confidence, driving the downward trajectory in the stock.
Technical Analysis of BHP Group Ltd (BHP)
Technically, BHP Group Ltd (BHP) shows a MACD (12,26,9) value of -1.169, indicating a sell signal. The RSI at 26.003 suggests sell condition and the Williams %R at 96.581 suggests oversold condition. Please monitor closely.
Fundamental Analysis of BHP Group Ltd (BHP)
BHP Group Ltd (BHP) is in the Mineral Resources industry. Its latest annual revenue is $58.76B, ranking 2 in the industry. The net profit is $9.83B, ranking 2 in the industry. Company Profile
Over the past month, multiple analysts have rated the company as Hold, with an average price target of $77.25, a high of $96.00, and a low of $61.50.
More details about BHP Group Ltd (BHP)
Company Specific Risks:
- Copper Production Drops and Operational Disruption: In its Q1 operational review filed on October 20, 2026, BHP reported a 19% year-over-year decline in total copper output to 400.7 kilotonnes, driven by lower feed grades, severe weather disruptions in Chile, and a major conveyor belt failure at the Carrapateena operation.
- Workplace Fatalities and Regulatory Scrutiny: Operational updates disclosed safety-related work stoppages and ongoing formal investigations following two fatal workplace incidents at the Escondida and Peak Downs operations, exposing the company to regulatory liabilities and potential site suspensions.
- Iron Ore Realized Price Softness: Despite minor volume gains in Western Australia, average realized iron ore prices dropped 9% year-over-year to $76.27 per ton, compounding margin risks amid broader volatility in Chinese steel demand and macroeconomic demand shifts.
- Jurisdictional Competitiveness and Capital Allocation Risks: At BHP's October 22, 2026 annual general meeting, leadership emphasized growing regulatory and tax-incentive disadvantages in Australia compared to global peers like Canada, highlighting heightened execution and return risks for long-term capital investments.
This article may include AI-generated content that is human-reviewed, which is for reference and general information purposes only and does not constitute investment advice.
Recommended Articles








Comments (0)
Click the $ button, enter the symbol, and select to link a stock, ETF, or other ticker.