


Procter & Gamble Co Stock (PG) Moved Up by 5.19% on Oct 22: A Full Analysis



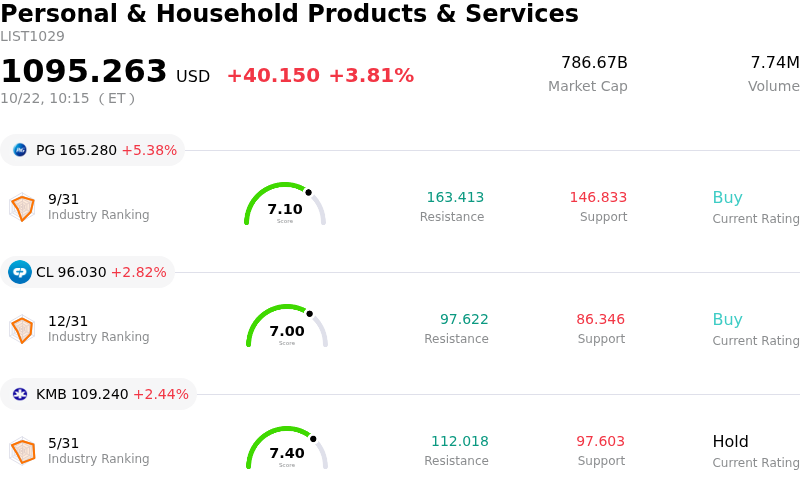
Procter & Gamble Co (PG) moved up by 5.19%. The Personal & Household Products & Services sector is up by 3.81%. The company outperformed the industry. Top 3 stocks by turnover in the sector: Procter & Gamble Co (PG) up 5.29%; Colgate-Palmolive Co (CL) up 2.82%; Kimberly-Clark Corp (KMB) up 2.44%.
What is driving Procter & Gamble Co (PG)’s stock price up today?
Procter & Gamble experienced notable upward price momentum and intraday trading activity following the release of its first-quarter fiscal year 2027 financial results. The consumer packaged goods leader delivered stronger-than-expected top- and bottom-line performance, reassuring institutional investors regarding the company's volume resilience, execution capability, and pricing strength across global markets.
Quarterly net sales grew four percent year-over-year to $23.28 billion, topping Wall Street consensus expectations. Organic sales also increased four percent, supported by broad-based growth across all major product categories and geographic divisions. Adjusted core earnings per share came in at $2.00, surpassing average analyst estimates. The performance was underpinned by positive sales volume trends and steady pricing power in key segments such as Beauty and Fabric & Home Care, demonstrating operational efficiency despite persistent economic and geopolitical headwinds.
Management affirmed its full-year fiscal 2027 outlook for organic sales growth, core EPS growth, and free cash flow productivity, while updating net sales guidance to account for the strategic acquisition of Thorne. In addition, the company demonstrated continued commitment to shareholder returns by returning $3.9 billion through dividends and share repurchases during the quarter. The market's positive reaction reflects investor appreciation for P&G's steady cash flow generation, strong dividend coverage, and defensive qualities in a volatile market environment.
Technical Analysis of Procter & Gamble Co (PG)
Technically, Procter & Gamble Co (PG) shows a MACD (12,26,9) value of 2.299, indicating a buy signal. The RSI at 74.046 suggests buy condition and the Williams %R at 7.162 suggests overbought condition. Please monitor closely.
Media Coverage of Procter & Gamble Co (PG)
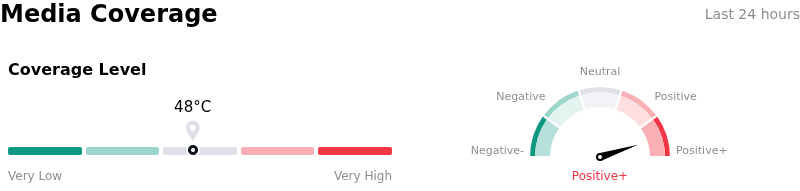
In terms of media coverage, Procter & Gamble Co (PG) shows a coverage score of 48, indicating a moderate level of media attention. The overall market sentiment index is currently in extremely bullish zone.
Fundamental Analysis of Procter & Gamble Co (PG)
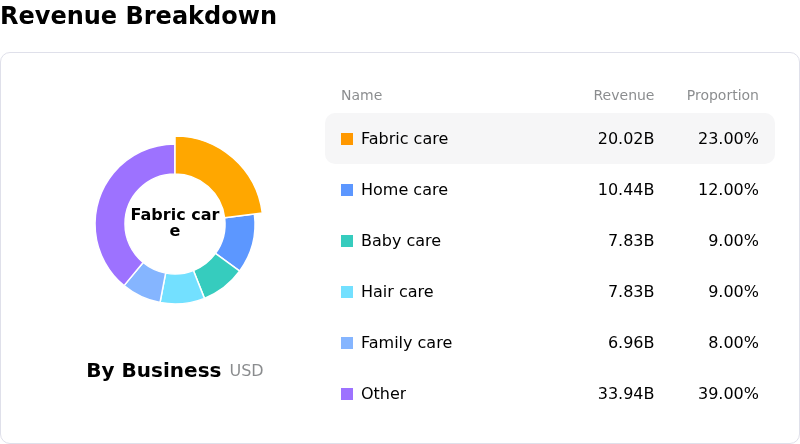
Procter & Gamble Co (PG) is in the Personal & Household Products & Services industry. Its latest annual revenue is $87.03B, ranking 1 in the industry. The net profit is $15.75B, ranking 1 in the industry. Company Profile
Over the past month, multiple analysts have rated the company as Buy, with an average price target of $161.44, a high of $186.00, and a low of $143.00.
More details about Procter & Gamble Co (PG)
Company Specific Risks:
- Operating Margin Compression: Procter & Gamble reported a contraction in its fiscal Q1 operating margin to 25.5%, down from 26.2% in the prior-year period, demonstrating that rising costs are constraining profitability despite top-line growth.
- Escalating Commodity and Transportation Costs: Management is facing approximately $1 billion in after-tax profit pressure from elevated raw materials, energy, and logistics expenses, compounded by an extra $150 million drag from higher net interest expenses.
- Consumer Trade-Down Risk and Volume Pressures: Ongoing inflation and tighter household budgets in key markets like North America are heightening the risk of consumers shifting away from premium P&G brands toward lower-cost private-label substitutes.
- Bearish Derivatives Positioning and Volatility: Elevated options put-to-call ratios of 1.4x reflect heightened institutional hedging against post-earnings downside risk, increasing price sensitivity if productivity savings fail to offset margin headwinds.
This article may include AI-generated content that is human-reviewed, which is for reference and general information purposes only and does not constitute investment advice.
Recommended Articles








Comments (0)
Click the $ button, enter the symbol, and select to link a stock, ETF, or other ticker.