


Revolution Medicines Inc Stock (RVMD) Moved Up by 7.41% on Oct 20: Facts Behind the Movement



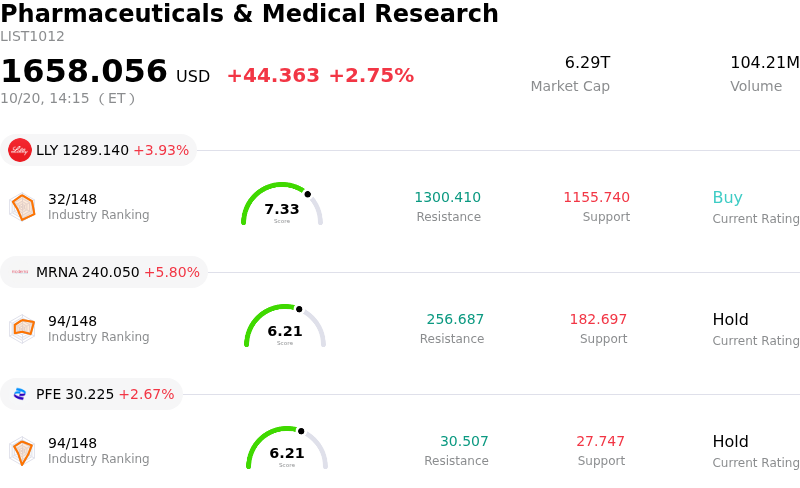
Revolution Medicines Inc (RVMD) moved up by 7.41%. The Pharmaceuticals & Medical Research sector is up by 2.75%. The company outperformed the industry. Top 3 stocks by turnover in the sector: Eli Lilly and Co (LLY) up 3.93%; Moderna Inc (MRNA) up 5.80%; Pfizer Inc (PFE) up 2.67%.
What is driving Revolution Medicines Inc (RVMD)’s stock price up today?
Revolution Medicines experienced strong upward momentum accompanied by notable intraday volatility, driven primarily by significant clinical pipeline advancements and positive Wall Street commentary. A major catalyst for the rally was the company's announcement regarding key late-stage development milestones, including the initiation of patient treatment in new global Phase 3 clinical trials. These studies evaluate zoldonrasib, an investigational RAS(ON) G12D-selective inhibitor, both in combination with standard-of-care regimens and alongside the company's broader RAS-targeted portfolio for pancreatic ductal adenocarcinoma. The continued expansion of late-stage trials reinforced investor enthusiasm regarding the execution and depth of the firm's precision oncology engine.
Commercial optimism surrounding the company's lead oncology asset, RASONQUE, also provided substantial support to market sentiment. Following positive regulatory developments and expanding global market potential in pancreatic cancer, multiple sell-side research firms published bullish notes and raised their price targets. Analysts emphasized strong early patient conversion trends and robust demand expectations ahead of upcoming financial reporting. Wall Street commentary also noted that prior short-term pullbacks driven by sub-group data concerns were overdone, highlighting the best-in-class potential of the company's selective inhibitor pipeline.
From a market strategy perspective, the session's intraday trading range reflects high-beta volatility common among commercial-stage biotech firms navigating major clinical transitions. However, the prevailing buy-side sentiment remains constructive, anchored by strong balance sheet cash reserves, first-mover advantage in targeting active RAS proteins, and upcoming data readouts across multiple solid tumor indications. The combination of clinical milestone execution and Wall Street upgrades successfully catalyzed a strong shift in buying interest.
Technical Analysis of Revolution Medicines Inc (RVMD)
Technically, Revolution Medicines Inc (RVMD) shows a MACD (12,26,9) value of -1.889, indicating a sell signal. The RSI at 50.014 suggests neutral condition and the Williams %R at 43.580 suggests buy condition. Please monitor closely.
Fundamental Analysis of Revolution Medicines Inc (RVMD)
Revolution Medicines Inc (RVMD) is in the Pharmaceuticals & Medical Research industry. Its latest annual revenue is $0.00, ranking 362 in the industry. The net profit is $-1.13B, ranking 625 in the industry. Company Profile
Over the past month, multiple analysts have rated the company as Buy, with an average price target of $259.78, a high of $320.00, and a low of $179.00.
More details about Revolution Medicines Inc (RVMD)
Company Specific Risks:
- FDA Review Subgroup Efficacy Concerns: Regulatory multidisciplinary review documents for recently approved RASONQUE (daraxonrasib) revealed significant variance in objective response rates (ORR) across KRAS mutation subtypes, showing a lower 24% ORR in the G12D subtype versus 50% in G12V. This disclosure has raised institutional concerns over broad commercial adoption across all mutation sub-populations.
- Persistent Insider Stock Sales: Market disclosures indicate significant ongoing insider equity liquidation, with over $59 million to $78 million in insider sales and zero insider stock purchases over recent months. This ongoing selling activity continues to create structural overhang and weigh on trader sentiment during volatile intraday swings.
- High Leverage and Debt Service Commitments: SEC filings confirm a $250 million drawdown under Tranche A of a senior secured term loan facility with Royalty Pharma. The loan carries a high variable interest rate equal to SOFR plus 5.75% (with a 3.50% floor) alongside a $5 million draw fee, increasing fixed financial commitments while product revenues remain in early stages.
- Elevated Valuation Multiple and Ongoing Losses: Trading at an exceptionally high price-to-sales ratio above 70x while continuing to generate quarterly net operating losses, the company's valuation leaves no room for execution missteps. This fundamental unprofitability exposes the high-beta equity to severe intraday price compression during broader biotech risk-off shifts.
This article may include AI-generated content that is human-reviewed, which is for reference and general information purposes only and does not constitute investment advice.
Recommended Articles







Comments (0)
Click the $ button, enter the symbol, and select to link a stock, ETF, or other ticker.