


Mueller Industries Inc Stock (MLI) Moved Down by 9.91% on Oct 20: Key Drivers Unveiled



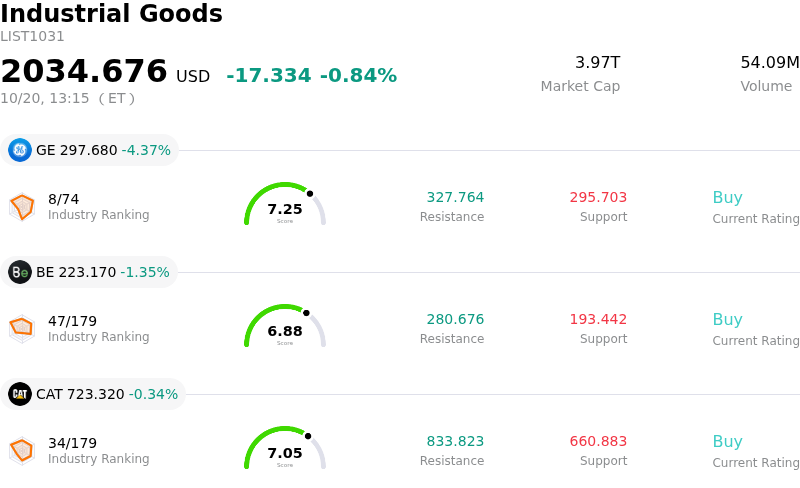
Mueller Industries Inc (MLI) moved down by 9.91%. The Industrial Goods sector is down by 0.84%. The company underperformed the industry. Top 3 stocks by turnover in the sector: General Electric Co (GE) down 4.37%; Bloom Energy Corp (BE) down 1.31%; Caterpillar Inc (CAT) down 0.39%.
What is driving Mueller Industries Inc (MLI)’s stock price down today?
Mueller Industries experienced sharp downward pressure following the release of its third-quarter financial results, as lower-than-expected earnings per share overshadowed strong top-line revenue performance. Although net sales expanded substantially year-over-year—beating consensus expectations on robust unit volumes across core segments—diluted earnings per share fell short of Wall Street forecasts. The disconnect between robust revenue momentum and weaker bottom-line expansion disappointed market participants who had anticipated higher profit conversion, triggering immediate selling after nine consecutive quarters of year-over-year growth.
A primary factor weighing on investor sentiment was margin compression relative to top-line expansion. While elevated copper prices and pricing adjustments tied to material cost inflation boosted reported revenues, operating income grew at a far more modest pace. Profitability was further burdened by non-recurring purchase accounting charges associated with recent acquisitions. Although executive commentary pointed to growing backlogs supported by commercial construction and accelerating U.S. data center expansions, these demand drivers were offset by a prolonged contraction in residential construction, highlighting persistent end-market divergence.
Beyond operational results, technical factors and market positioning amplified the stock's downside. The equity entered the earnings announcement with a fragile technical setup, already trading beneath key short- and medium-term moving averages. Coupled with recent insider selling activity and stretched valuation multiples prior to the print, institutional investors quickly repriced near-term growth expectations. The resulting volatility reflects a broad recalibration of risk, as the market looks for clearer evidence that volume growth and expanding data center exposure can fully overcome cost inflation and residential headwinds.
Technical Analysis of Mueller Industries Inc (MLI)
Technically, Mueller Industries Inc (MLI) shows a MACD (12,26,9) value of -0.726, indicating a sell signal. The RSI at 27.227 suggests sell condition and the Williams %R at 93.516 suggests oversold condition. Please monitor closely.
Fundamental Analysis of Mueller Industries Inc (MLI)
Mueller Industries Inc (MLI) is in the Industrial Goods industry. Its latest annual revenue is $4.18B, ranking 40 in the industry. The net profit is $765.19M, ranking 22 in the industry. Company Profile
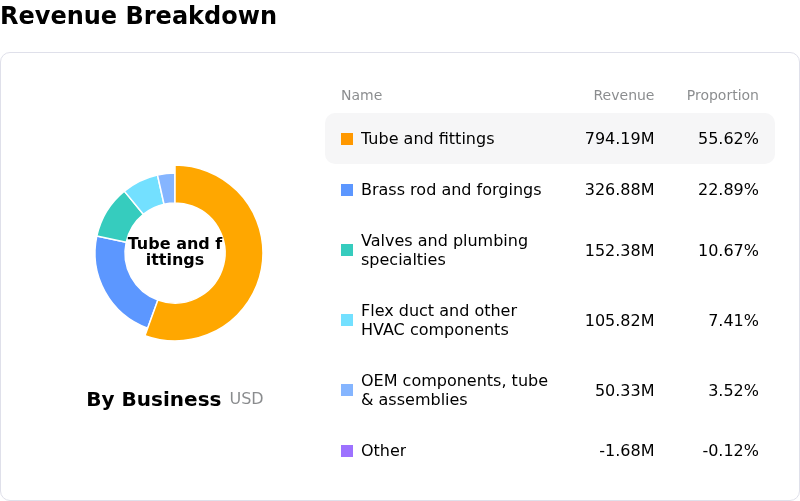
Over the past month, multiple analysts have rated the company as Strong Buy, with an average price target of $80.00, a high of $80.00, and a low of $80.00.
More details about Mueller Industries Inc (MLI)
Company Specific Risks:
- Q3 Earnings Miss and Margin Compression: Mueller Industries reported Q3 2026 adjusted earnings per share of $1.00, missing Wall Street expectations and triggering an intraday decline of up to 7.9% to a four-month low. Despite a 31.6% top-line increase to $1.42 billion, operating income grew just 2%, exposing severe operating margin compression as higher sales failed to generate proportional profit growth.
- Material-Cost Inflated Top Line and Copper Volatility: Third-quarter revenue growth was heavily driven by passing along inflated raw material costs, as average COMEX copper prices surged 34.2% year-over-year to $6.48 per pound. This structural reliance on commodity pass-through pricing exposes the business model to sharp revenue contraction and inventory de-stocking if copper prices retreat.
- Persistent Housing Sector and Residential Construction Weakness: Broader slowdowns across the residential housing market continue to weigh on volume demand for core plumbing, heating, and HVAC piping products. This persistent end-market slump forces the company to rely disproportionately on data center and commercial building demand to sustain sales.
- Acquisition Purchase Accounting Drag: Q3 performance was diluted by $9.4 million in purchase accounting charges related to recent corporate acquisitions. These non-operational charges highlight integration friction and financial overhead that threaten near-term earnings predictability.
This article may include AI-generated content that is human-reviewed, which is for reference and general information purposes only and does not constitute investment advice.
Recommended Articles







Comments (0)
Click the $ button, enter the symbol, and select to link a stock, ETF, or other ticker.