


BNB (BNBUSD) Is up 1.45% on Oct 20: Why It Happened



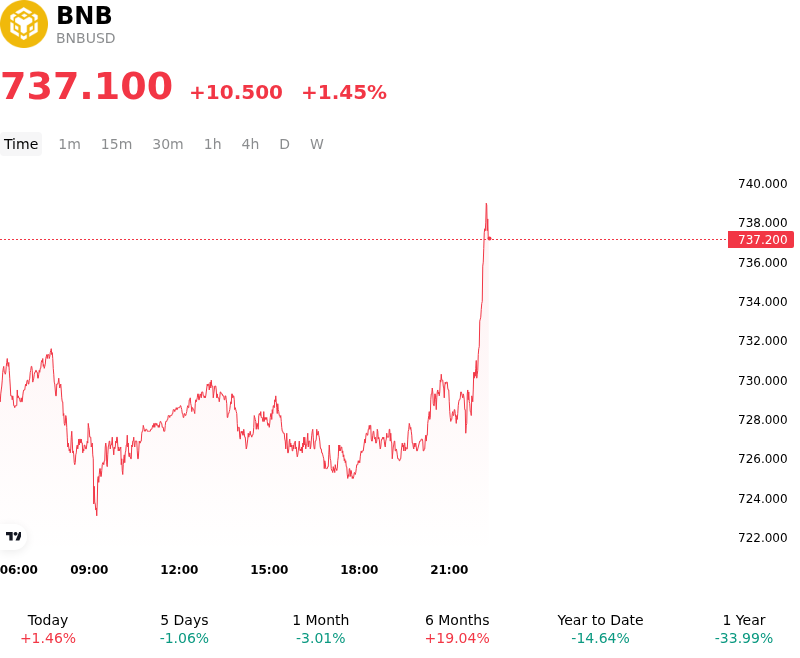
BNB (BNBUSD) is up 1.45% at Oct 20 10:20(ET), now at $737.1, with a 7-day down of 0.53%.
What is driving BNB (BNBUSD)’s stock price up today?
Capital flowed back into BNB as technical oversold conditions triggered defensive short covering and spot accumulation following a brief period of downside pressure across major altcoins. With daily momentum indicators reaching extended oversold levels, derivative positioning shifted from leveraged shorting toward tactical long exposure. This technical stabilization occurred alongside broader crypto market resilience, providing a supportive backdrop for layer-one protocol assets with high ecosystem utility and sustained fee generation.
Investor sentiment was further bolstered by fundamental progress within the BNB Chain ecosystem, particularly rising market engagement around the next-generation EVM-compatible base layer architecture. Designed to handle high-frequency trading, real-time payments, and autonomous artificial intelligence workloads, the proposed high-performance network mandates BNB as its sole gas token. Expectations surrounding this infrastructure expansion reinforced long-term demand drivers for the token, as market participants priced in future network scaling capable of supporting agentic trading and ultra-low transaction latency.
Institutional participation and corporate treasury activity provided additional structural support. The ongoing expansion of corporate entities holding BNB in balance-sheet reserves and transitioning into active validator network infrastructure highlights growing enterprise integration. By converting treasury holdings into active yield-generating network validators, institutional market participants are helping lock up floating token supply while embedding BNB deeper into enterprise infrastructure.
Looking ahead, systematic supply constraints, including periodic auto-burn mechanisms and expanding real-world asset tokenization across the ecosystem, continue to strengthen the asset's structural valuation floor. However, institutional investors continue to monitor macro monetary policy expectations, global liquidity conditions, and regulatory developments affecting exchange-linked ecosystems as primary risk factors.
Technical Analysis of BNB (BNBUSD)
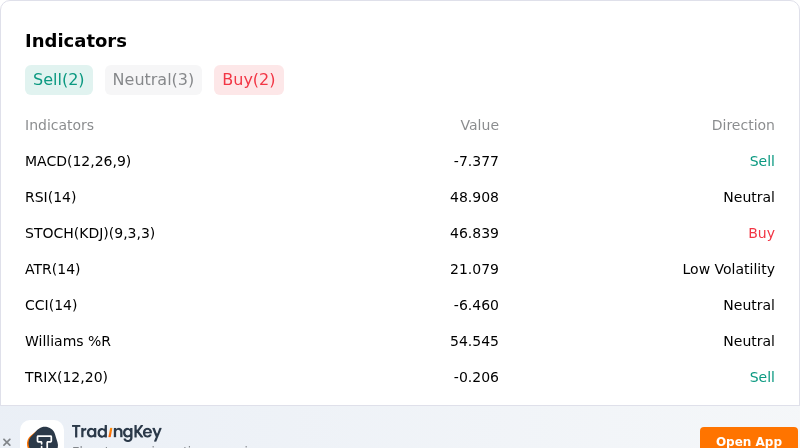
Technically, BNB (BNBUSD) shows a MACD (12,26,9) value of -7.377, indicating a sell signal. The RSI at 48.908 suggests neutral condition and the Williams %R at 54.545 suggests neutral condition. Please monitor closely.
More details about BNB (BNBUSD)
Recent Events and Risks:
- Regulatory and Sanctions Scrutiny: Renewed regulatory investigations into Binance regarding compliance commitments and transaction monitoring have increased platform risk premiums, putting persistent downward pressure on BNB.
- Technical Structure Breakdown and Liquidation Risks: BNB falling below its $750 weekly pivot and key 20-day and 50-day moving averages has triggered liquidation clusters, exposing the token to deeper corrective moves toward $700 support.
- Whale Inflows and Spot Dump Risk: On-chain data showing large whale transfers of BNB into exchange wallets to cover unrealized losses raises immediate risks of sell-side market impact and reduced market depth.
- Ecosystem Security Exploits and Sell Pressure: Recent decentralized protocol exploits on BNB Chain resulting in prompt token dumping have created localized selling pressure, compounding downside momentum across the ecosystem.
This article may include AI-generated content that is human-reviewed, which is for reference and general information purposes only and does not constitute investment advice.
Recommended Articles








Comments (0)
Click the $ button, enter the symbol, and select to link a stock, ETF, or other ticker.