


XRP (XRPUSD) Fluctuated Significantly on Oct 20: Key Variables Behind the Move



XRP (XRPUSD) is up 2.19% at Oct 20 10:10(ET), now at $1.3296, with a 7-day down of 2.94%.
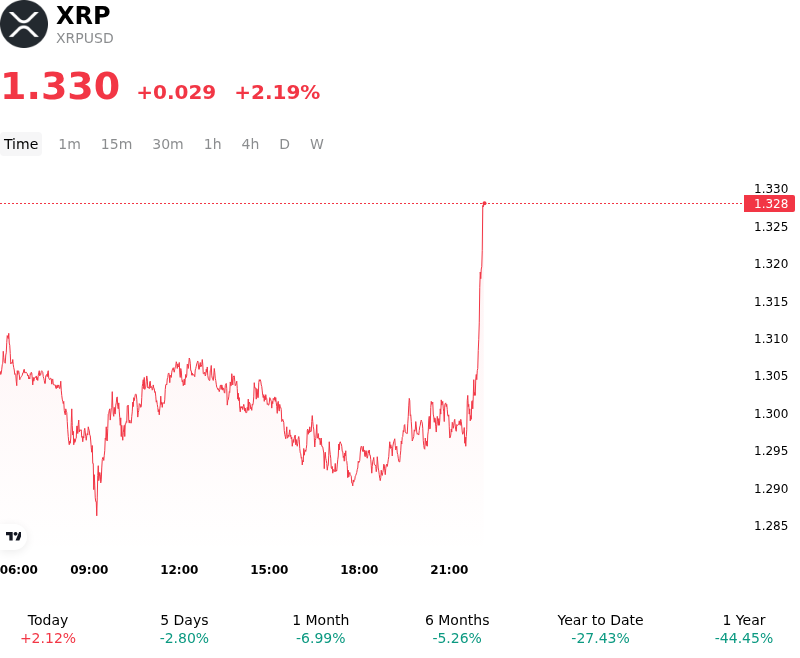
What is driving XRP (XRPUSD)’s stock price up today?
Capital allocation into XRP reflected a localized recovery driven by opportunistic buying near key technical support levels, backed by ongoing institutional ecosystem expansion. Support around recent lows held firmly as market participants digested broader corporate treasury developments, including public listing activity for institutional digital asset entities holding substantial XRP treasuries. This structural baseline, alongside expanding access across European banking distribution channels, bolstered underlying confidence in payment-network adoption despite recent broader digital asset market consolidation.
On-chain metrics indicated that large-scale capital movements were primarily custodial transfers rather than exchange-bound liquidations. Significant whale activity observed on the XRP Ledger involved token reallocations toward fresh holding addresses without immediate sell-side pressure, signaling strategic balance sheet management and institutional custody positioning. In the derivatives market, open interest stabilized as short positioning was unwound near support. The absorption of sell orders provided a favorable liquidity backdrop for spot inflows, encouraging leverage to rebuild after previous risk-off momentum subsided.
From a broader macro standpoint, digital assets continue to navigate shifting global liquidity expectations, elevated Treasury yields, and impending Federal Reserve monetary policy decisions. While spot ETF flows experienced a temporary pause following weeks of sustained momentum, structural interest in compliant cross-border settlement protocols remains intact. The intraday price action demonstrates resilient demand during consolidation phases, though market participants continue to monitor macro liquidity conditions, regulatory shifts, and token escrow releases.
Technical Analysis of XRP (XRPUSD)
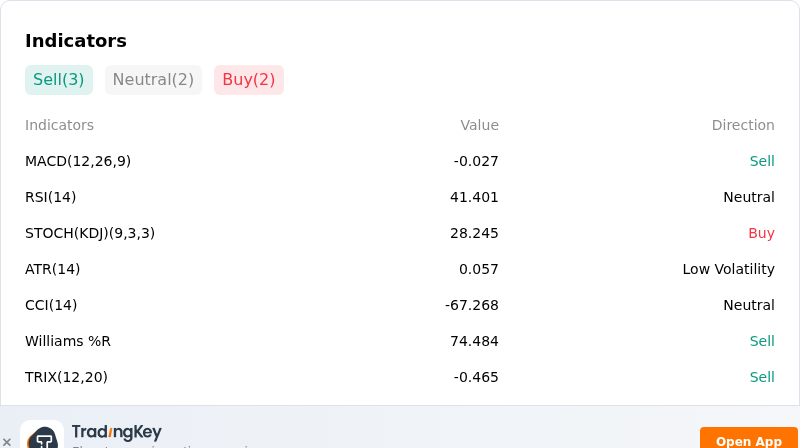
Technically, XRP (XRPUSD) shows a MACD (12,26,9) value of -0.027, indicating a sell signal. The RSI at 41.401 suggests neutral condition and the Williams %R at 74.484 suggests sell condition. Please monitor closely.
More details about XRP (XRPUSD)
Recent Events and Risks:
- Overleveraged Long Exposure and Liquidation Pressure: Market data indicates that nearly 97% of net-long derivatives positions were established at prices above $1.31, exposing underwater leveraged traders to heightened margin call and liquidation risks during downside volatility.
- Spike in Exchange Reserves and Supply Overhead: Total XRP exchange reserves climbed to a 1-year high of roughly 11.81 billion tokens, shifting on-chain metrics into the 99th percentile and signaling potential distribution and elevated selling pressure onto secondary exchanges.
- Institutional Reversal in Spot ETF Outflows: U.S.-listed spot XRP ETFs logged weekly net outflows for the first time in 14 weeks, ending a prolonged accumulation streak and pointing to cooling institutional demand amid macroeconomic caution.
- Technical Breakdown Below Critical Moving Averages: XRP dropped below key structural support levels, including its weekly 200-day Exponential Moving Average and converging daily moving averages near $1.38–$1.40, threatening further momentum losses toward the $1.25 support zone.
This article may include AI-generated content that is human-reviewed, which is for reference and general information purposes only and does not constitute investment advice.
Recommended Articles








Comments (0)
Click the $ button, enter the symbol, and select to link a stock, ETF, or other ticker.