


Solana (SOLUSD) Is up 1.64% on Oct 20: Here Is Why



Solana (SOLUSD) is up 1.64% at Oct 20 10:05(ET), now at $105.25, with a 7-day down of 0.84%.
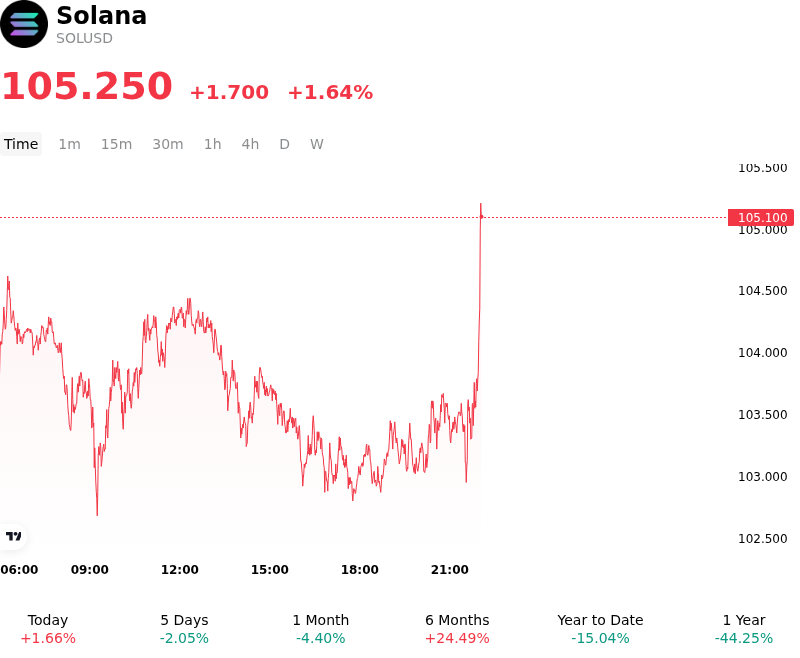
What is driving Solana (SOLUSD)’s stock price up today?
Capital allocated toward Solana advanced as market participants actively positioned ahead of the impending activation of the Alpenglow consensus upgrade. The anticipated transition away from the legacy TowerBFT framework toward a streamlined consensus architecture designed to reduce transaction finality to roughly 150 milliseconds generated positive risk sentiment across digital asset desks. Institutional and native crypto traders re-priced execution speed improvements, viewing the protocol upgrade as a pivotal catalyst for enhanced throughput across decentralized finance, high-frequency trading applications, and cross-chain liquidity rails.
The upward movement was reinforced by strong technical defense near key psychological support levels, which attracted systematic buying interest and triggered short-covering in the derivatives space. On-chain metrics underscored resilient network fundamentals, with Solana continuing to lead competing smart contract platforms in decentralized application revenue generation and trading throughput. This fundamental strength provided a firm floor for asset valuations, enabling spot accumulation to absorb secondary market liquidity and offset recent temporary headwinds observed in spot exchange-traded fund channels.
Despite the constructive intraday price action, institutional investors remain attentive to operational risks associated with major network overhauls, including potential validator node re-synchronization delays or brief RPC endpoint disruptions during epoch transition. Furthermore, persistent macro uncertainty ahead of upcoming central bank monetary policy decisions and ongoing fluctuations in spot ETF net flows require cautious risk management. Nonetheless, the combination of protocol innovation, robust ecosystem fee generation, and technical support defense positioned Solana as a primary beneficiary of risk-on capital flows ahead of the mainnet shift.
Technical Analysis of Solana (SOLUSD)
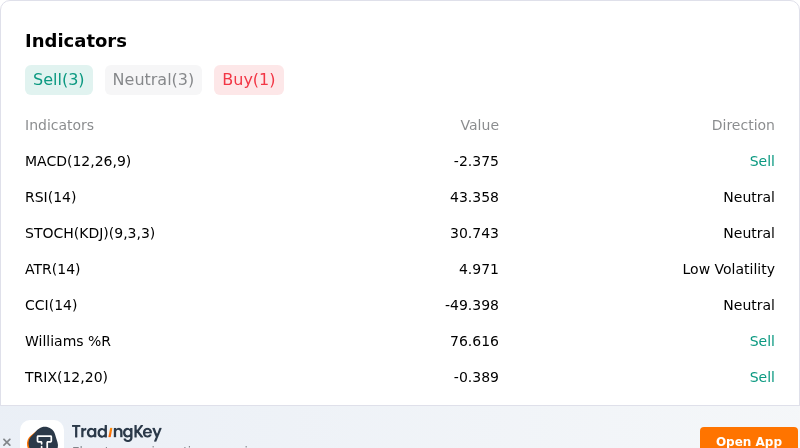
Technically, Solana (SOLUSD) shows a MACD (12,26,9) value of -2.375, indicating a sell signal. The RSI at 43.358 suggests neutral condition and the Williams %R at 76.616 suggests sell condition. Please monitor closely.
More details about Solana (SOLUSD)
Recent Events and Risks:
- Sustained Institutional Spot ETF Outflows: Extended net redemptions across spot Solana ETFs have created continuous overhead supply pressure, signaling reduced institutional appetite for high-beta layer-1 tokens and weakening spot market demand.
- Whale Exchange Deposits and Supply Overhang: Recent large-scale transfers of SOL from private wallets directly onto centralized exchange deposit addresses have heightened trader concerns over potential spot dumping and defensive risk reduction by major holders.
- Derivatives Deleveraging and Critical Support Vulnerability: Price action pressing against key support thresholds around the $100 psychological level has amplified long liquidation risks, leaving futures open interest vulnerable to cascading sell-offs if key technical buffers fail.
- On-Chain Stablecoin Liquidity Contraction: A contraction in circulating stablecoin reserves across Solana-based decentralized protocols has degraded DEX order book depth, making spot prices significantly more sensitive to sharp intraday slippage during periods of market stress.
This article may include AI-generated content that is human-reviewed, which is for reference and general information purposes only and does not constitute investment advice.
Recommended Articles








Comments (0)
Click the $ button, enter the symbol, and select to link a stock, ETF, or other ticker.