


General Electric Co Stock (GE) Opened Down by 3.45% on Oct 20: A Full Analysis



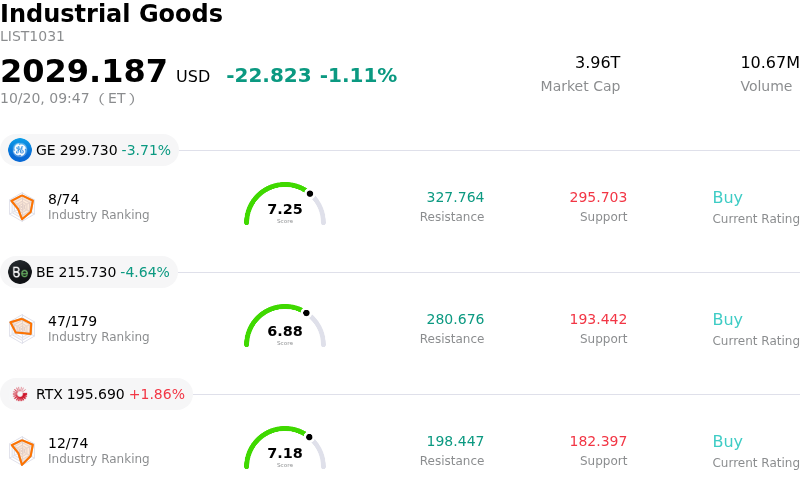
General Electric Co (GE) opened down by 3.45%. The Industrial Goods sector is down by 1.11%. The company underperformed the industry. Top 3 stocks by turnover in the sector: General Electric Co (GE) down 3.45%; Bloom Energy Corp (BE) down 4.69%; RTX Corp (RTX) up 1.86%.
What is driving General Electric Co (GE)’s stock price down today?
GE Aerospace experienced downward pressure and heightened volatility during the session following the release of its third-quarter financial results. Despite delivering top-line and bottom-line figures that surpassed market consensus alongside a full-year guidance raise, the stock succumbed to profit-taking and investor anxiety over underlying operational cost pressures. Market participants reacted sharply to rising engine-service expenses, durability reserves, and operational allowances that weighed on free cash flow generation relative to high buy-side expectations.
A detailed examination of the report reveals a beat-and-raise quarterly print that was overshadowed by cash flow and cost headwinds. While commercial engine orders and long-term aftermarket service demand remained strong, elevated warranty and durability costs required to address engine maintenance, along with ongoing supply chain bottlenecks, dampened market enthusiasm. The year-over-year decline in quarterly free cash flow signaled that margin expansion in commercial aviation services is facing friction from higher input costs and service allowances.
From a market sentiment perspective, GE Aerospace entered the earnings event with a premium valuation, leaving minimal room for operational friction. Institutional profit-taking, combined with broader industry caution regarding persistent supply chain constraints across aerospace and defense manufacturers, contributed to the intraday retreat. Moving forward, investor confidence will depend on management's capability to execute on its substantial multi-year backlog while effectively mitigating engine delivery delays and maintenance cost inflation.
Technical Analysis of General Electric Co (GE)
Technically, General Electric Co (GE) shows a MACD (12,26,9) value of 1.565, indicating a neutral signal. The RSI at 34.194 suggests neutral condition and the Williams %R at 80.646 suggests oversold condition. Please monitor closely.
Media Coverage of General Electric Co (GE)
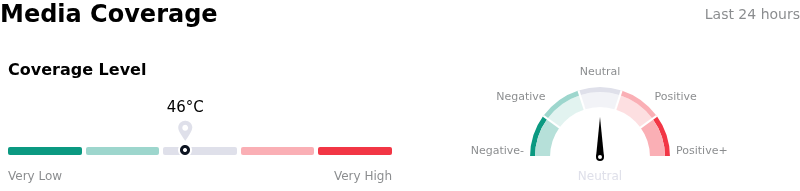
In terms of media coverage, General Electric Co (GE) shows a coverage score of 46, indicating a moderate level of media attention. The overall market sentiment index is currently in neutral zone.
Fundamental Analysis of General Electric Co (GE)
General Electric Co (GE) is in the Industrial Goods industry. Its latest annual revenue is $45.85B, ranking 5 in the industry. The net profit is $8.70B, ranking 1 in the industry. Company Profile
Over the past month, multiple analysts have rated the company as Buy, with an average price target of $390.96, a high of $435.00, and a low of $305.00.
More details about General Electric Co (GE)
Company Specific Risks:
- Supply Chain Bottlenecks and Engine Turnaround Delays: Persistent component shortages continue to stretch narrowbody engine maintenance turnaround times to around 95 days versus the 70-day target, impairing LEAP engine delivery schedules and compressing manufacturing margins.
- Elevated Valuation Multiple Vulnerability: With shares trading at a rich valuation of roughly 36 to 37 times forward earnings, the stock is exposed to severe intraday price drawdowns if aftermarket demand or quarterly financial metrics fail to exceed high analyst expectations.
- High Dependence on Commercial Aftermarket Growth: High revenue concentration in commercial engine services leaves overall profitability vulnerable to potential moderations in airline flight hours, maintenance deferrals, or broader travel demand slowdowns.
- Operating Cash Flow Friction from Production Spending: Massive capital commitments allocated to resolve supply chain bottlenecks have created pressure on operating cash flow, leading to year-over-year cash generation declines despite overall revenue gains.
This article may include AI-generated content that is human-reviewed, which is for reference and general information purposes only and does not constitute investment advice.
Recommended Articles








Comments (0)
Click the $ button, enter the symbol, and select to link a stock, ETF, or other ticker.